
There is a comfortable fiction that many Amazon sellers still live inside: that keyword research is something you do once — maybe twice a year — and then it’s done. You build your list, fill your backend search terms, set your PPC campaigns, and move on to the next product.
In 2024, that approach was already showing cracks. In 2026, it is actively costing sellers money.
The Amazon search environment has changed structurally, not just incrementally. Search Frequency Rank data now moves week to week, sometimes day to day, in ways that older seasonal planning cycles simply cannot track. The introduction of COSMO and Rufus has shifted Amazon from a system that matches words to one that matches meaning. Consumer intent patterns have fractured into multiple demand peaks across the calendar year rather than one big holiday surge. And the core, generic keywords that used to be the obvious place to compete are now 23–31% more crowded than they were in 2024, according to seller data compiled across categories.
The sellers who are pulling ahead are not the ones with the longest keyword lists. They are the ones with live keyword systems — playbooks that treat keyword data as a continuous input rather than a periodic task. That is what this post is about: not just which keywords are trending, but how to build the operational machinery that keeps your keyword strategy current, responsive, and tied directly to revenue outcomes.
We will move from the mechanics of how Amazon search signals work today, through the architecture of a tiered keyword system, into a practical weekly cadence you can run without a full-time SEO team. By the end, you will have a repeatable framework — a live playbook, not a static document.
The Velocity Problem: How Fast Amazon’s Search Frequency Rank Actually Moves
Amazon’s Search Frequency Rank (SFR) is not a fixed number. It is a relative popularity rank — position 1 means the most-searched term in the marketplace at that moment, and every other keyword is ranked below it in descending order of search volume. The critical word is “relative.” SFR does not measure absolute search count. It measures how a keyword performs compared to every other keyword on the platform at any given time.
That distinction matters enormously for how you interpret movement. If a keyword drops from SFR 4,200 to SFR 6,800 in three weeks, that could mean searches for that term fell sharply — or it could mean a competing cluster of terms (say, a viral product or a seasonal shift) surged above it. Understanding the cause of SFR movement is just as important as seeing the movement itself.
How Quickly Does SFR Actually Change?
Expert practitioners in 2026 treat 4 to 12 weeks as the meaningful window for interpreting SFR trend durability. Within that window, keywords fall into three behavioral categories:
- Spike terms: Keywords driven by viral moments, trending products (like “needoh” or “switch 2” earlier in 2026), or short news cycles. SFR can move dramatically within days. These terms are high-risk, high-reward and require daily monitoring during the spike window.
- Seasonal terms: Keywords that predictably rise and fall on calendar cycles — “back to school backpack,” “summer camp gear,” “Christmas gift for dad.” SFR movement is foreseeable but the timing is more compressed than sellers often expect; demand typically begins 3–4 weeks before the cultural moment, not at it.
- Structural terms: Core category keywords with relatively stable SFR over months, punctuated by gradual drift. These are your foundation terms, but “stable” does not mean “uncrowded.” As noted, competition on core terms like “wireless earbuds” or “protein powder” has intensified by 23–31% compared to 2024.
Why Weekly Snapshots Are Now the Minimum
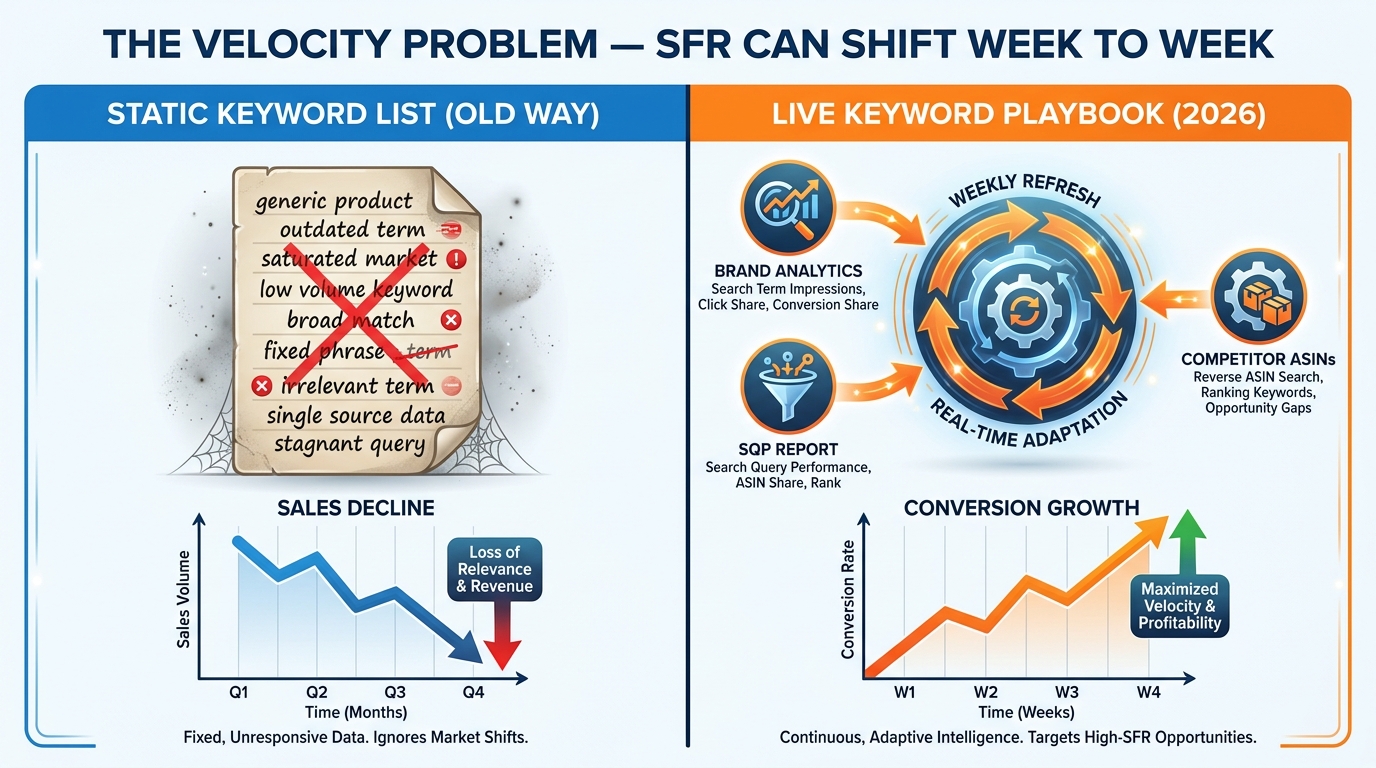
Amazon’s Brand Analytics Search Terms report allows you to pull weekly data on SFR for keywords relevant to your category. The problem most sellers face is that they pull this data monthly — or quarterly — and by the time they act on a trend, the SFR window has already shifted.
In 2026, weekly SFR snapshots are the minimum operating cadence. Sellers using daily tracking on their top 30–50 keywords report being able to spot SFR trend changes early enough to adjust PPC bids, swap out listing copy, and capture emerging demand before competitors have noticed the shift.
The practical workflow is straightforward: export your Brand Analytics Search Terms report weekly, compare SFR for your tracked keywords against the previous week, flag any term that has moved more than 1,000 positions in either direction, and run it through a decision tree — is this a spike, a seasonal onset, or a structural drift? Each answer triggers a different response protocol, which we will build out later in this post.
The COSMO/Rufus Effect: Why Amazon No Longer Reads Your Listing the Way It Used To

For years, Amazon’s A9 algorithm rewarded sellers who got keywords into the right fields — the title, bullets, backend search terms — with enough repetition to signal relevance. That system rewarded keyword density. It was gameable, and sellers gamed it well.
COSMO changed the underlying physics. Amazon’s COSMO is a commonsense knowledge graph that maps products, queries, buyers, and behaviors into a network of entities and relationships. Instead of asking “does this listing contain the word ‘wireless’?”, COSMO asks a more complex set of questions: Who is this product for? What situations is it used in? What constraints matter to the buyer — price, size, compatibility, occasion? How does it compare to alternatives?
What Rufus Actually Does to Keyword Strategy
Rufus is the consumer-facing layer of Amazon’s AI search stack. When a shopper types or speaks a query, Rufus interprets it through the COSMO graph rather than doing pure text matching. The practical consequences for sellers are significant:
- Query length is increasing. Rufus-enabled sessions are generating longer, more conversational queries. Instead of “coffee maker,” shoppers are asking “coffee maker that fits under low cabinets and doesn’t leak.” Classic short keyword targeting misses these entirely.
- Reviews and Q&A are now ranking signals. Because Rufus pulls from listing content, reviews, and Q&A sections to answer shopper intent, products with rich review content and answered questions rank better in Rufus-surfaced results — even when those answers don’t live in traditional keyword fields.
- Semantic coverage beats keyword repetition. A listing that covers multiple relevant use cases — even without exact keyword repetition — now outperforms a listing stuffed with exact-match terms that only cover one intent scenario.
Reframing Keyword Research as Intent Cluster Research
The shift from A9 to COSMO/Rufus means your keyword research process needs a second layer. You are no longer just asking “what words do shoppers type?” You are asking “what situations, problems, audiences, and constraints drive those searches?”
An intent cluster for a portable blender, for example, might include:
- Use case: gym, office, travel, camping
- Audience: college students, remote workers, fitness enthusiasts
- Constraint: USB charging, under 20oz, dishwasher safe, quiet motor
- Comparison: vs NutriBullet, vs Magic Bullet, vs full-size blender
Each of these dimensions generates a family of keywords — long-tail phrases, question-format queries, and natural language comparisons — that COSMO can match to your product without requiring exact-string placement in your listing. The sellers who map these clusters systematically are building a much wider semantic footprint than those still running traditional keyword tools alone.
The practical takeaway: for every core product, build an intent cluster map before you build a keyword list. The keyword list should serve the intent clusters, not the other way around.
Reading the Signals: What Brand Analytics and the SQP Report Tell You That Volume Tools Don’t
Third-party keyword tools — Helium 10, Jungle Scout, DataDive, and others — are indispensable for the research phase. They surface search volume estimates, keyword difficulty scores, and historical trend data at scale. But they have a fundamental limitation: they show you the market. They do not show you your gap within the market.
That gap is exactly what Amazon’s own native tools are built to reveal, and in 2026, most sellers are still dramatically underusing them.
Amazon Brand Analytics: The SFR Is the Signal, Not the Number
Brand Analytics gives registered brand owners access to the Search Terms report, which shows SFR for keywords alongside the top three clicked ASINs for each term. The critical insight most sellers miss: the top-clicked ASINs are more valuable data than the SFR itself.
When you see a keyword with a strong SFR (low number = high demand) and the top three clicked ASINs are all small-brand or relatively weak listings, that is an entry signal. When the top three clicked positions are locked by established brands with thousands of reviews and well-optimized listings, the SFR alone tells you demand exists — but the ASIN data tells you the competitive reality of accessing that demand.
The playbook move: filter your Brand Analytics export to keywords where the top-clicked ASINs have fewer than 500 reviews and where at least one position is occupied by a brand with a below-average listing quality score. Those are the highest-probability keyword opportunities in your category right now.
The Search Query Performance Report: Your Conversion Funnel by Keyword
The Search Query Performance (SQP) report is the most underused data source on Amazon Seller Central. Unlike Brand Analytics — which shows category-level SFR and top clicks — SQP shows your brand’s specific performance metrics for each search query that led to an impression, click, cart add, or purchase of your ASIN.
The metrics that matter most:
- Query Search Volume (QSV): The estimated total number of searches for this query during the period. This is the closest thing Amazon provides to an absolute search volume number.
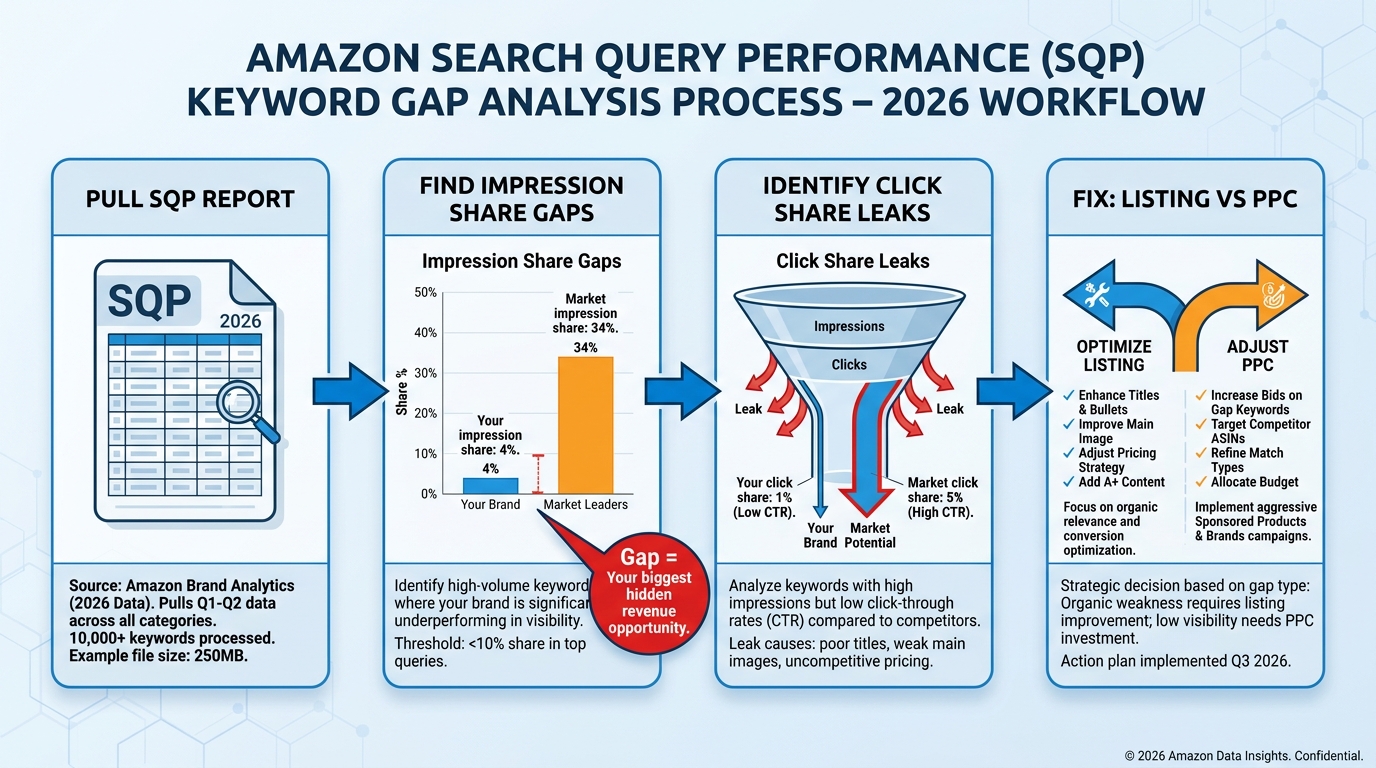
- Impression Share: Your brand’s impressions divided by total impressions for that query across all ASINs. If the market generated 50,000 impressions on “stainless steel water bottle 32oz” and your ASIN received 2,000, your impression share is 4%.
- Click Share: Your clicks as a percentage of total clicks on that query. A high impression share with low click share indicates a title or main image problem — you are showing up but not compelling the click.
- Purchase Share: Your purchases as a percentage of total purchases driven by that query. A high click share with low purchase share points to a conversion problem on the detail page — your listing is not closing.
Running a Keyword Gap Analysis with SQP
The keyword gap analysis using SQP is a four-step process:
- Pull 90-day SQP data for your top ASINs. Export to a spreadsheet.
- Sort by Query Search Volume descending. Focus on the top 200 queries by volume — these represent the bulk of category demand.
- Flag all queries where your impression share is below 10%. For any high-volume query where you are barely visible, you have a structural gap — either the listing is not relevant enough for Amazon to show it, or your PPC is not supporting it.
- Cross-reference with click share. For queries where your impression share is 10–30% but click share is below 5%, the problem is a front-end creative issue, not a ranking issue. The fix is listing copy and imagery, not more keywords or more ad spend.
This analysis typically surfaces 15–25 high-value keyword opportunities per product in a 90-day cycle — opportunities that third-party tools simply cannot identify because they do not have access to your specific funnel data.
The Three-Tier Keyword Architecture That Survives Algorithm Volatility
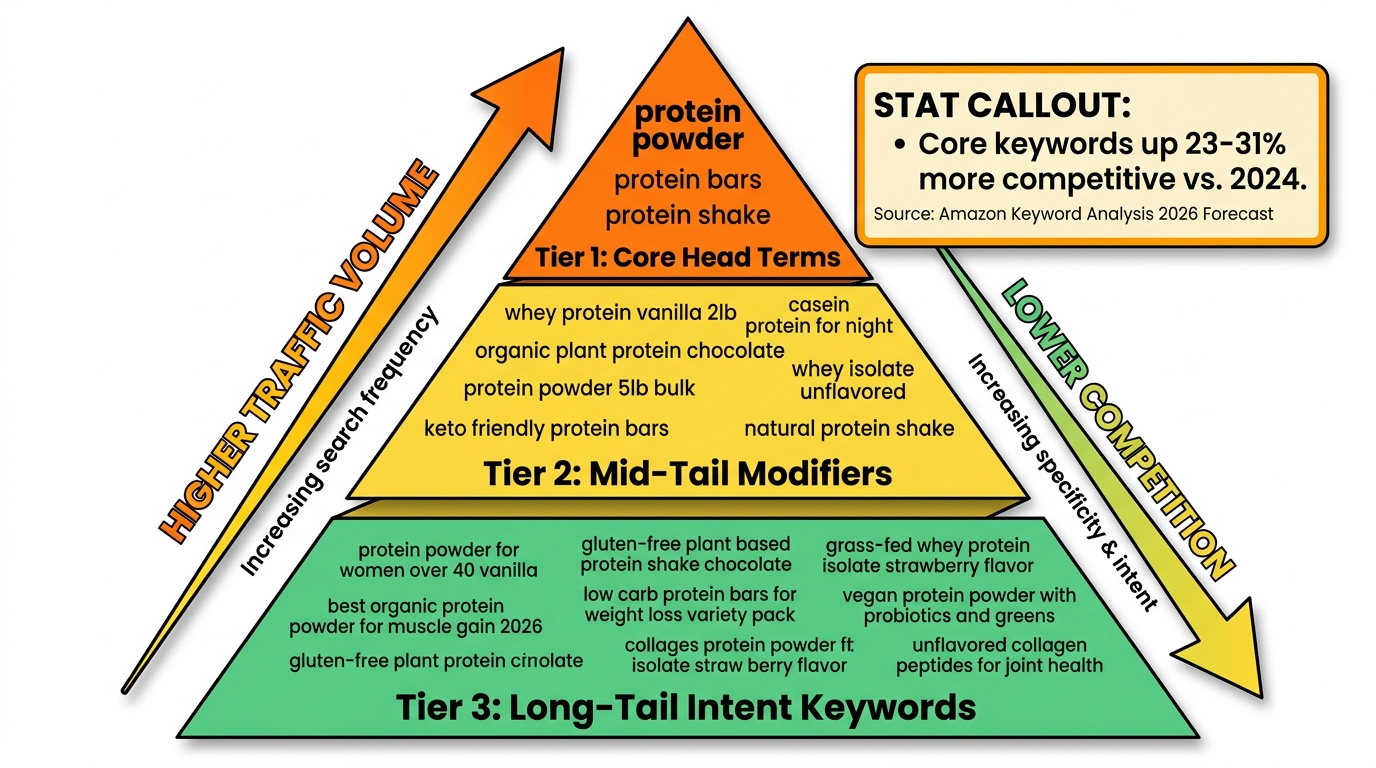
The fundamental problem with most sellers’ keyword strategy is that it is flat. Every keyword gets roughly equal treatment: equal placement consideration, equal bid weight, equal optimization priority. That approach made sense when Amazon search was simpler. In 2026, with dramatically increased competition on core terms and the COSMO semantic layer rewarding contextual relevance over keyword density, a flat keyword strategy leaves money on the table at both ends.
The architecture that works in the current environment is a three-tier system. Each tier has a different role, a different update cadence, and a different primary placement strategy.
Tier 1: Core Head Terms (Update Cadence: Monthly)
These are your 5–10 highest-volume, category-defining keywords. Examples: “protein powder,” “wireless earbuds,” “stainless steel water bottle.” They drive enormous search volume but are also the most contested keywords in your category — and the ones where competition has intensified most sharply in 2026.
Primary placement: Title (first 60–80 characters where possible), first bullet. These are the terms that Amazon’s indexing system weights most heavily from title placement.
Strategy: You need to be present on Tier 1 terms, but do not expect organic rank wins here in the short term unless you have strong sales velocity and review depth. Use Tier 1 terms to anchor PPC Sponsored Products campaigns, and treat PPC spend here as brand visibility investment as much as direct conversion spend.
Update cadence: Review monthly. Core terms move slowly unless there is a major category disruption. Check whether any formerly core terms are losing SFR to more specific variants — this signals a structural intent shift that should be tracked.
Tier 2: Mid-Tail Modifiers (Update Cadence: Bi-Weekly)
Tier 2 keywords are the middle ground: specific enough to indicate purchase intent, broad enough to drive meaningful volume. These are often formed by adding one or two modifiers to a core term: “whey protein vanilla,” “wireless earbuds noise cancelling,” “stainless steel water bottle 32oz insulated.”
Primary placement: Remaining title space after core terms, bullets 2–5, backend search terms field (first 200 characters). These terms add specificity to your listing without sacrificing relevance on broader queries.
Strategy: Tier 2 is where the best organic ranking opportunities exist in 2026. These terms are specific enough that fewer competitors are fully optimizing for them, but they carry enough volume to generate real revenue impact. Focus your SQP gap analysis primarily on this tier — the impression share and click share gaps here are the most actionable.
Update cadence: Review bi-weekly. Tier 2 terms respond to seasonal modifiers and trend shifts more readily than Tier 1 terms. A mid-tail term that was flat in Q1 may surge in Q2 as seasonal demand arrives.
Tier 3: Long-Tail Intent Phrases (Update Cadence: Weekly)
Tier 3 is where the COSMO shift has created the most new opportunity. These are highly specific, often question-format or constraint-driven phrases: “protein powder for women over 40 vanilla low sugar,” “wireless earbuds for small ears that don’t fall out running,” “stainless steel water bottle that fits in car cup holder 32oz.”
Primary placement: Backend search terms (remaining space after Tier 1 and 2 terms), A+ Content descriptive text, Q&A section responses, product description.
Strategy: Individually, Tier 3 terms carry low volume. Collectively, they can represent 40–60% of a well-optimized product’s total search-driven traffic. COSMO’s semantic matching means that your listing content — including A+ Content and review keywords — is being used to surface your product on Tier 3 queries even without exact-match placement. Seeding your Q&A and A+ Content with intent-specific language accelerates this process.
Update cadence: Review weekly, using a combination of Rufus query monitoring (test common questions about your product type), customer review mining for natural language phrases, and competitor ASIN reverse-lookup to surface terms you may have missed.
Seasonality Is Not What It Used To Be: Navigating Amazon’s Multi-Peak Demand Calendar
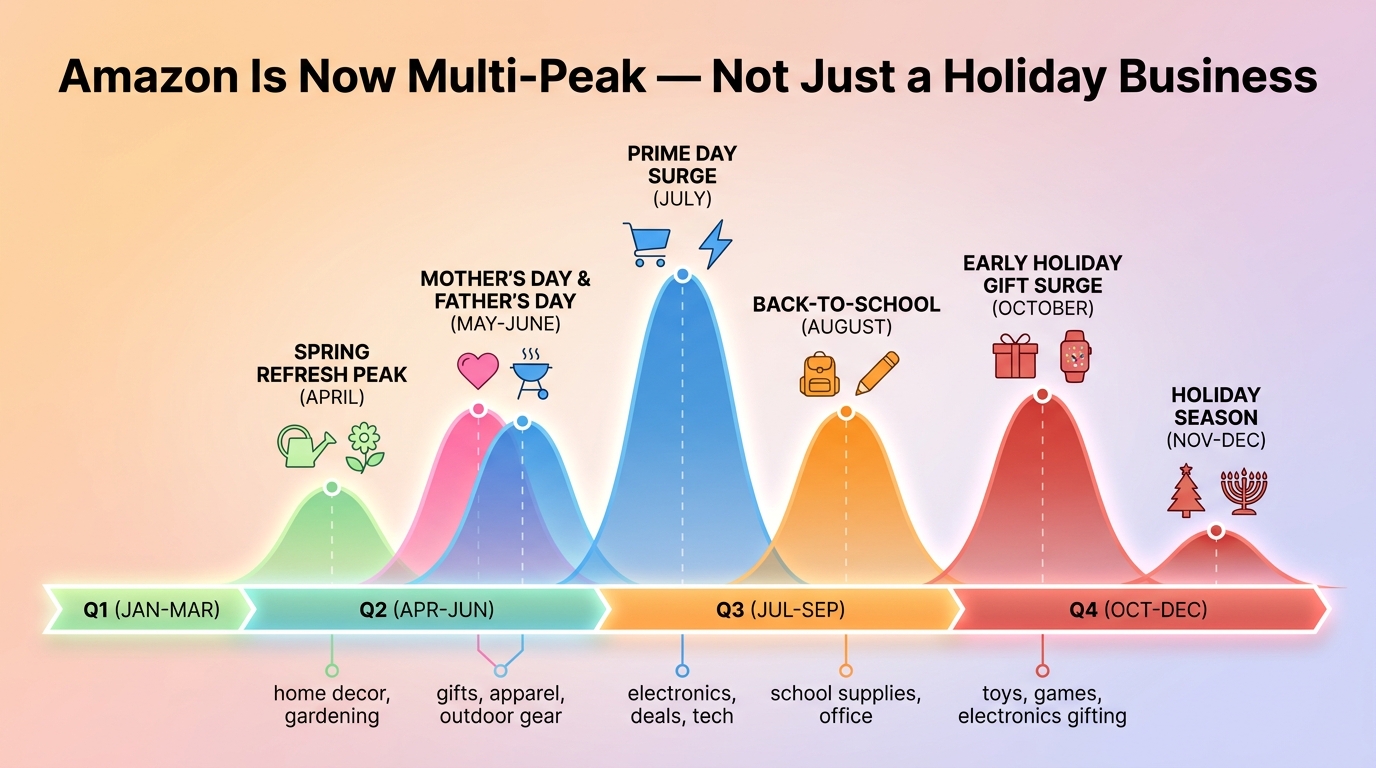
The old Amazon seasonality playbook was simple: optimize for the holiday peak (October through December), treat the rest of the year as maintenance, and budget accordingly. That mental model is now structurally outdated.
Amazon’s 2026 demand calendar has fragmented into at least six distinct demand peaks across the year, each with its own keyword surge patterns and category winners. Sellers who are planning their keyword updates and bid strategies around a single annual peak are leaving significant Q1-through-Q3 revenue on the table.
The 2026 Multi-Peak Calendar
Here is how the major demand peaks now play out across the keyword landscape:
Valentine’s Day / Winter Wellness (January–February): “Gift for her,” “gift for him,” and health/fitness resolution keywords surge in January, transitioning to Valentine’s gift modifiers through mid-February. Categories: fitness equipment, supplements, personal care, jewelry, home items.
Spring Refresh (March–April): Home organization, cleaning, outdoor furniture, and gardening keywords spike. The modifier pattern here is “upgrade” and “new” — shoppers are in a replacement mindset. Categories: home decor, cleaning products, garden tools, outdoor furniture.
Mother’s Day / Father’s Day (May–June): Gift modifier keywords — “gift for mom,” “best gift for dad,” “birthday gift” — surge sharply. Critically, these peaks arrive earlier than sellers expect. “Gift for mom” SFR typically begins climbing 3–4 weeks before Mother’s Day, not in the final week. Categories: kitchen, beauty, gadgets, experiences, personalized items.
Prime Day / Summer Prep (July): Electronics, travel accessories, outdoor recreation, and fitness gear dominate. Prime Day creates a unique SFR pattern: broad “deal” and “sale” modifier searches spike, but specific product queries also intensify as shoppers do comparison research ahead of the event.
Back-to-School (August–September): School supplies, tech accessories, dorm room essentials, and organizational products surge. The B2S window is earlier than many sellers plan for — searches begin rising in mid-July. Categories: backpacks, stationery, desk accessories, headphones, storage.
Early Holiday / Q4 (October–December): The traditional peak, but now starting earlier. Toy and gift searches are measurably rising in October, with the major surge arriving in mid-November. The keyword environment in Q4 is the most competitive of the year by far, which is exactly why the other five peaks represent better ROI windows for many sellers.
The Three-Week Rule for Seasonal Keyword Updates
The single most common timing mistake in seasonal keyword strategy is updating listings at the peak instead of before it. Amazon takes time to re-index listings after changes, and organic rank for freshly optimized keywords does not appear instantaneously. The practical rule in 2026 is a three-week lead time: seasonal keyword updates, listing refreshes, and PPC bid increases should be executed three weeks before the expected SFR peak for the relevant demand pattern.
For Prime Day-specific keywords, that means updating in mid-June. For Back-to-School, that means late July. For Q4, it means the first week of October for most categories, with holiday-specific terms added in mid-October.
The Competitor Keyword Gap Method: Mining What Your Rivals Rank For Without Copying Their Listings
Reverse ASIN analysis — looking up the keywords that a competitor’s ASIN ranks for organically — is one of the oldest plays in Amazon keyword research. It is also one of the most commonly done wrong.
The wrong version: pull every keyword that a competing ASIN ranks for, dump them into your listing, and assume you’ll capture similar traffic. The result is usually a listing that is incoherent to both the COSMO semantic layer and to real shoppers, with keyword strings that don’t fit naturally into bullet points and a title that reads like a search term dump.
The right version is a gap analysis that asks a more precise question: which keywords does my competitor rank for that I do not, where my product is genuinely more relevant or competitive? That constraint — genuine relevance — is what separates keyword additions that improve performance from keyword additions that dilute it.
Running the Competitor Gap Analysis in 2026
Here is the current best-practice workflow, applicable in tools like Helium 10 Cerebro, Jungle Scout, or DataDive:
- Select 3–5 competitor ASINs that are genuinely similar to your product — not the best-selling ASIN in the category if it’s a fundamentally different product, but the closest structural competitors in terms of price point, audience, and product attributes.
- Run a reverse ASIN lookup on each competitor and export their organic keyword rankings.
- Cross-reference with your own SQP data. Any keyword where a competitor ranks in the top 20 organically, but where your SQP shows zero or near-zero impressions, is a genuine gap — you are not even appearing for a term where a similar product is winning.
- Apply the relevance filter. For each gap keyword, ask: if a shopper searched this exact phrase, would my product be a genuinely good result? If the answer is yes and your product attributes clearly support it, the keyword belongs in your optimization plan. If the answer is “maybe, but only loosely,” do not add it — COSMO’s semantic layer will penalize poorly-fitted keyword additions via lower conversion rates, which feed back into organic rank negatively.
- Prioritize by SFR + competitor organic rank. The highest-value gap terms are those with strong SFR (high demand), a competitor ranking in positions 1–10 organically, and your current impression share at or near zero. These represent the clearest opportunities to close a competitive gap.
What to Do With the Gap Terms You Find
Not every gap term belongs in the same place. Map each gap term to your three-tier architecture based on its volume and specificity, then place it accordingly. Mid-tail gap terms should be incorporated into listing copy revisions — bullets, title addendums, or A+ Content. Long-tail gap terms belong in backend search terms and Q&A content. Tier 1 gap terms (where you are missing on a core category term entirely) are a signal that your listing’s fundamental relevance signals need attention — usually a title rework.
Backend Search Terms in the Rufus Era: What Still Works and What to Stop Doing
Backend search terms have always been somewhat mysterious to sellers. They are invisible to shoppers, not displayed anywhere on the listing, and their exact impact on ranking has never been officially quantified by Amazon. In 2026, with COSMO and Rufus reshaping how Amazon indexes and surfaces products, the role of backend search terms has evolved in ways that are worth addressing directly.
What Backend Search Terms Still Do
Backend search terms remain an indexing signal. Including a keyword in the search terms field still tells Amazon’s indexing system that your product is relevant to that query — it just does so with less weight than a title or bullet placement, and with no PPC amplification (PPC targeting comes from your ad campaigns, not backend terms).
In the COSMO era, backend search terms are particularly useful for:
- Alternate phrasings and synonyms: Terms that mean the same thing as your title keywords but are phrased differently. “Reusable water bottle” and “refillable water bottle” and “BPA-free water bottle” might all describe the same product — use backend terms to cover the variants you couldn’t fit in your title and bullets.
- Spelling variations and common misspellings: “Bluetooth” vs “bluetoth” vs “blue tooth.” Amazon’s system handles many misspellings, but covering common variants in backend terms can capture indexing gaps.
- Spanish-language terms (for US marketplace): If your product category has Spanish-language search volume (many do in health, personal care, kitchen, and baby categories), backend terms are the right place to add Spanish translations without disrupting English-language listing flow.
- Long-tail intent phrases that couldn’t fit naturally in listing copy: The most specific Tier 3 terms from your intent cluster map belong here.
What to Stop Doing in Backend Search Terms
Several common backend search term practices are now actively counterproductive:
- Repeating keywords already in your title and bullets: Amazon’s indexing system recognizes repetition and does not assign additional weight for it. Repeated keywords in backend terms waste the 250-byte limit without adding indexing coverage.
- Competitor brand names: Amazon’s guidelines prohibit this, and enforcement has tightened. The risk is not worth the marginal indexing benefit.
- Irrelevant keywords you are hoping to “borrow” traffic from: COSMO’s semantic matching means that if a search query lands on your product and shoppers immediately bounce (low click-through or high return rate), it signals to the algorithm that your product is a poor match for that intent. Irrelevant keywords in backend terms that somehow generate impressions can actively hurt your conversion-weighted ranking signals.
- Punctuation, articles, and filler words: Amazon’s algorithm ignores prepositions, articles (a, the, for), and commas automatically. Use that space for additional relevant keywords instead.
Running Weekly Feedback Loops: The 7-to-14-Day Keyword Testing Cadence
One of the most powerful operational shifts sellers can make in 2026 is moving from ad-hoc keyword testing to a structured, repeatable feedback loop. The 7-to-14-day cadence is short enough to capture meaningful data, long enough to filter out daily noise, and fast enough to make iterative progress on ranking and conversion within a single quarter.
The Weekly Feedback Loop Structure
Here is how a well-run weekly keyword feedback loop operates:
Monday: Pull and compare. Export your SQP report for the past 7 days. Compare impressions, click share, and purchase share against the previous week for your top 50 queries. Flag any keyword where impression share dropped more than 3 percentage points, or where click share dropped while impression share held steady (indicating a creative/copy issue emerged).
Tuesday: Diagnose and prioritize. For flagged keywords, determine the most likely cause. Impression share drops typically point to one of three causes: a competitor increased PPC spend on that term (check your ad auction insights), your listing lost indexing relevance (check if recent listing edits removed a keyword), or the term’s SFR moved (the total demand shifted, changing the relative competitive landscape). Click share drops without impression share drops almost always point to a listing front-end issue.
Wednesday–Thursday: Implement changes. Make one change at a time where possible, so attribution is clear. If you are testing a title revision, do not simultaneously change the main image and add new PPC targets — you will not be able to determine what drove any resulting metric change.
Friday: Document and set next week’s hypothesis. Keep a keyword experiment log. Record what changed, when it changed, the before-and-after metrics, and the hypothesis for why. This log becomes an invaluable reference over time — patterns emerge across products and categories that would be invisible without the documentation.
The 14-Day Rule for Listing Changes
For changes to listing copy (title, bullets, A+ Content), allow at least 14 days before evaluating the impact on organic rankings. Amazon’s indexing and ranking update cycle means that listing changes do not immediately translate into visible rank shifts. Sellers who make a change on Monday and check their keyword rank on Wednesday are evaluating noise, not signal.
For PPC bid changes and campaign structure updates, the feedback cycle is faster — 7 days of data is typically sufficient to see directional impact on ACoS, impressions, and click volume for specific keywords. This is why PPC and listing optimization should run on slightly different review cadences even though they inform each other.
Turning Keyword Data into PPC Bid Logic: Connecting Search Trends to Ad Spend
Keyword research and PPC management are often treated as separate disciplines inside Amazon seller operations. In 2026, that separation is a meaningful inefficiency. The most effective sellers are running a continuous loop between keyword performance data and PPC bid adjustments, using SFR changes and SQP metrics as direct inputs into campaign budget and bid decisions.
The SFR-to-Bid Matrix
A simple but powerful framework is the SFR-to-bid matrix — a systematic approach to scaling PPC bids up or down in response to observed SFR movement:
- SFR improving (rank number dropping) + your impression share holding or growing: Demand is rising and you are keeping pace. Maintain current bids and monitor for the opportunity to test modestly higher bids to capture incremental share before competition catches up.
- SFR improving + your impression share dropping: Demand is rising but competitors are outbidding you for the visibility. This is a bid increase signal — the incremental volume is worth competing for while the trend is in motion.
- SFR worsening (rank number rising) + your impression share holding: Overall demand for this term is contracting relative to other keywords. Maintain current bids but do not increase them. Watch for 3–4 weeks before deciding to reduce bids.
- SFR worsening + your impression share dropping: Double negative signal. The term is losing relative demand and you are losing visibility within that declining demand. Reduce bids and reallocate spend toward terms with favorable SFR momentum.
Seasonal Bid Ramps: Getting the Timing Right
Following the three-week lead time principle discussed in the seasonality section, PPC bid ramps for seasonal keywords should be staged rather than sudden. A staged approach — increasing bids by 20–30% per week for three weeks leading into a seasonal peak — performs better than a single large bid increase at the start of the peak. The staged ramp gives the algorithm time to accumulate positive click and conversion signals at each bid level before competing at full-peak rates.
The reverse applies on the way down: staged bid reductions over two weeks after a seasonal peak prevent sudden impressions drops that can disrupt your organic ranking signals for non-seasonal terms on the same ASIN.
Building Your Live Keyword Playbook: The Repeatable System
Everything discussed so far — SFR velocity monitoring, intent cluster mapping, SQP gap analysis, three-tier architecture, seasonal timing, and PPC bid logic — adds up to a system. But a system only delivers value if it runs consistently, and most Amazon sellers lack the operational infrastructure to run all of these components reliably.
The live keyword playbook solves this by turning the system into a documented, repeatable process with clear owners, cadences, and decision rules. Here is the structure.
The Playbook Core Documents
A functional live keyword playbook consists of four core documents, maintained in a shared workspace (Google Sheets, Notion, or a dedicated Amazon analytics tool):
Document 1: The Master Keyword Registry. A complete list of all keywords relevant to each ASIN in your catalog, organized by tier, with columns for: current SFR, SFR 30 days ago, SFR 90 days ago, primary placement (title/bullet/backend), current organic rank, current PPC impression share, and last-updated date. This is the reference document — every other analysis flows from it.
Document 2: The Weekly SFR Tracker. A running log of weekly SFR snapshots for your top 50–100 keywords per product. Seven columns of weekly SFR data side by side gives you an immediate visual of which terms are trending up, which are declining, and which are stable. Color-coding (green for improving SFR, red for worsening) makes it scannable in under two minutes.
Document 3: The SQP Gap Analysis Log. Updated monthly, this document captures your current impression share, click share, and purchase share gaps by keyword, alongside the gap priority score (a combination of query volume and gap size), and the action planned or taken to close each gap.
Document 4: The Experiment Log. A timestamped record of every listing change, PPC adjustment, or keyword addition/removal, with before-and-after metrics captured at 7 and 14 days post-change. This is the institutional memory of your keyword program — without it, you repeat the same experiments and mistakes indefinitely.
Who Runs What, and When
For sellers without a dedicated SEO or PPC team, the live keyword playbook can be run by one person spending approximately 3–4 hours per week. The distribution across the four documents looks roughly like this:
- 30 minutes per week: Update the SFR tracker with weekly Brand Analytics export data. Flag changes over 1,000 positions.
- 60 minutes per week: Review flagged SFR changes, diagnose likely causes, and determine action items (bid adjustment, listing update, or watch-and-wait).
- 60 minutes per month: Run the SQP gap analysis, update the gap log, and prioritize the top 5 gaps to address in the coming month.
- 60 minutes per quarter: Full review of the Master Keyword Registry. Add new terms surfaced by the SQP analysis and competitor gap mining. Remove terms that have shown no indexing or conversion impact over 90 days.
- 30 minutes per week: Update the experiment log with results from changes made the previous week.
When the Playbook Needs to Flex
The playbook is a system, not a rigid script. There are trigger conditions that should prompt an immediate out-of-cycle review:
- A competitor ASIN appears in your top 3 clicked competitors for a high-value keyword where they previously were not
- A keyword in your top 10 by revenue contribution drops more than 5,000 SFR positions in a single week
- Your SQP data shows a purchase share drop of more than 2 percentage points on a core keyword month-over-month
- A new viral or trending search term appears in your category (monitor Amazon’s “Movers and Shakers” and social commerce trends weekly as an early-signal proxy)
These trigger conditions should have documented response protocols in your playbook — so that when they occur, the team knows exactly what data to pull, who makes the decision, and within what timeframe. Speed of response is itself a competitive advantage in keyword management.
What the Data Says About 2026’s Fastest-Moving Categories
While every category has its own keyword dynamics, the 2026 search trend data points to several category-level patterns that sellers across multiple niches should be aware of, because they illustrate broader principles applicable beyond any single product type.
Electronics: The SFR Spike Problem
Electronics makes up 24% of the top 100 most-searched products on Amazon in early 2026, with terms like “kindle,” “laptop,” “iPad,” “monitor,” and “PS5” consistently holding top positions. But electronics is also the category with the most dramatic SFR spikes — device launches, viral review moments, and cross-platform cultural trends (like the Nintendo Switch 2 launch) can shift SFR for accessory and peripheral keywords dramatically within days.
For electronics accessory sellers, the practical implication is that your keyword playbook needs a “launch window protocol” — a predefined set of steps to execute when a major device launches that could affect demand for your product category. This includes pre-positioning PPC campaigns on anticipated accessory keywords, updating listing copy with device compatibility language, and monitoring SFR daily during the first two weeks post-launch.
Health and Wellness: Long-Tail Is the Real Game
Health and wellness is experiencing one of the clearest long-tail opportunity windows of any major category. The COSMO/Rufus shift has been particularly pronounced here: shoppers are searching with increasing specificity — not “protein powder” but “protein powder for women over 40 low sugar chocolate” — and the SFR for these highly specific terms has improved significantly as more shoppers use conversational query formats.
For health and wellness sellers, this means the Tier 3 keyword layer of your playbook deserves proportionally more investment than in other categories. Building out intent cluster maps that cover specific audiences (age, dietary restriction, health goal), use contexts (pre-workout, post-workout, meal replacement, travel), and constraint combinations (allergen-free, non-GMO, third-party tested) generates a semantic footprint that can drive substantial incremental traffic from terms that are too specific for many competitors to have noticed.
Home and Kitchen: Seasonal Sensitivity Amplified
The home and kitchen category exhibits the clearest multi-peak seasonality pattern of any major Amazon category. Spring refresh, fall nesting, holiday gifting, and New Year resolution all generate distinct keyword demand windows, and the modifier language shifts significantly across peaks. “Gift for mom” dominates in May. “Organization” and “storage” dominate in January. “Outdoor entertaining” dominates in May–June. “Holiday hosting” arrives in October.
For home and kitchen sellers, the playbook recommendation is to maintain a seasonal listing variant calendar — a pre-planned schedule of modifier keyword updates and bullet point revisions that align with each demand peak, executed three weeks in advance of the expected SFR surge. This is not about rewriting the entire listing for each season, but about updating the top bullet point and adding seasonal modifier terms to backend search terms at the right moments in the calendar.
Conclusion: The Shift From Keyword Research to Keyword Operations
The core shift that this entire post has been building toward is a reframing of what keyword strategy actually is. Keyword research — the one-time or periodic process of finding and cataloguing relevant terms — is a component of keyword operations. And in 2026’s Amazon search environment, operations is what determines outcomes.
The sellers who are winning on keyword performance are not necessarily the ones with the most sophisticated tools or the largest keyword lists. They are the ones who have built a system — a live playbook — that makes keyword data actionable on a weekly basis, responds to SFR shifts before the window closes, connects search trend signals directly to PPC bid logic, and documents what is working so that knowledge compounds over time.
The structural changes driving this shift — COSMO’s semantic search layer, Rufus’s intent-matching capability, the fragmentation of Amazon’s demand calendar into six or more distinct peaks, and the intensification of competition on core keywords — are not going to reverse. They represent the new baseline. Every element of the system described here is a response to that baseline, not a temporary workaround.
Your Action Plan: Where to Start
If you are building your live keyword playbook from scratch, here is the sequenced action plan:
- Week 1: Pull your SQP report for the last 90 days for your top 3 ASINs. Run the gap analysis. Identify your top 10 keyword gaps by query volume and impression share deficit. These are your first priorities.
- Week 2: Build your intent cluster map for each product. Map use cases, audiences, constraints, and comparisons. This generates your Tier 3 keyword candidates and reframes how you will update listing copy going forward.
- Week 3: Create your Master Keyword Registry. Classify all current keywords into the three-tier structure. Identify which Tier 2 gaps can be addressed in the next listing update cycle.
- Week 4: Implement your first listing updates, incorporating the SQP gap terms identified in Week 1. Document the changes in your Experiment Log with before-state metrics.
- Ongoing: Run the weekly SFR tracking cadence. Review flagged changes every Monday. Update the experiment log every Friday. Run the SQP gap analysis monthly. Full registry review quarterly.
The live keyword playbook is not built in a day, and it does not run itself. But sellers who have implemented structured keyword operations report that the operational investment — 3–4 hours per week on average — returns outsized results relative to the same time spent on ad-hoc keyword adjustments or reactive campaign management.
In 2026, static keyword lists are a liability. The playbook is how you replace them with something that actually keeps up.