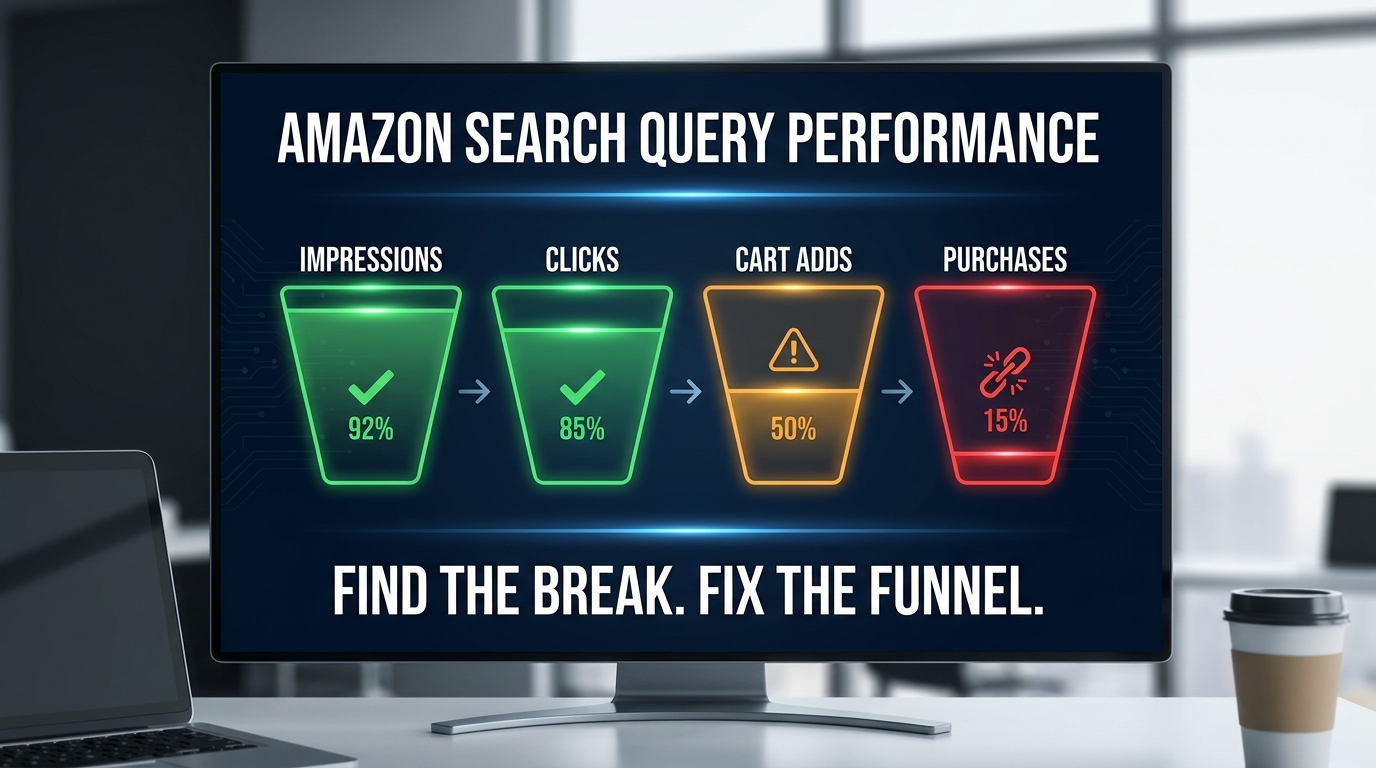

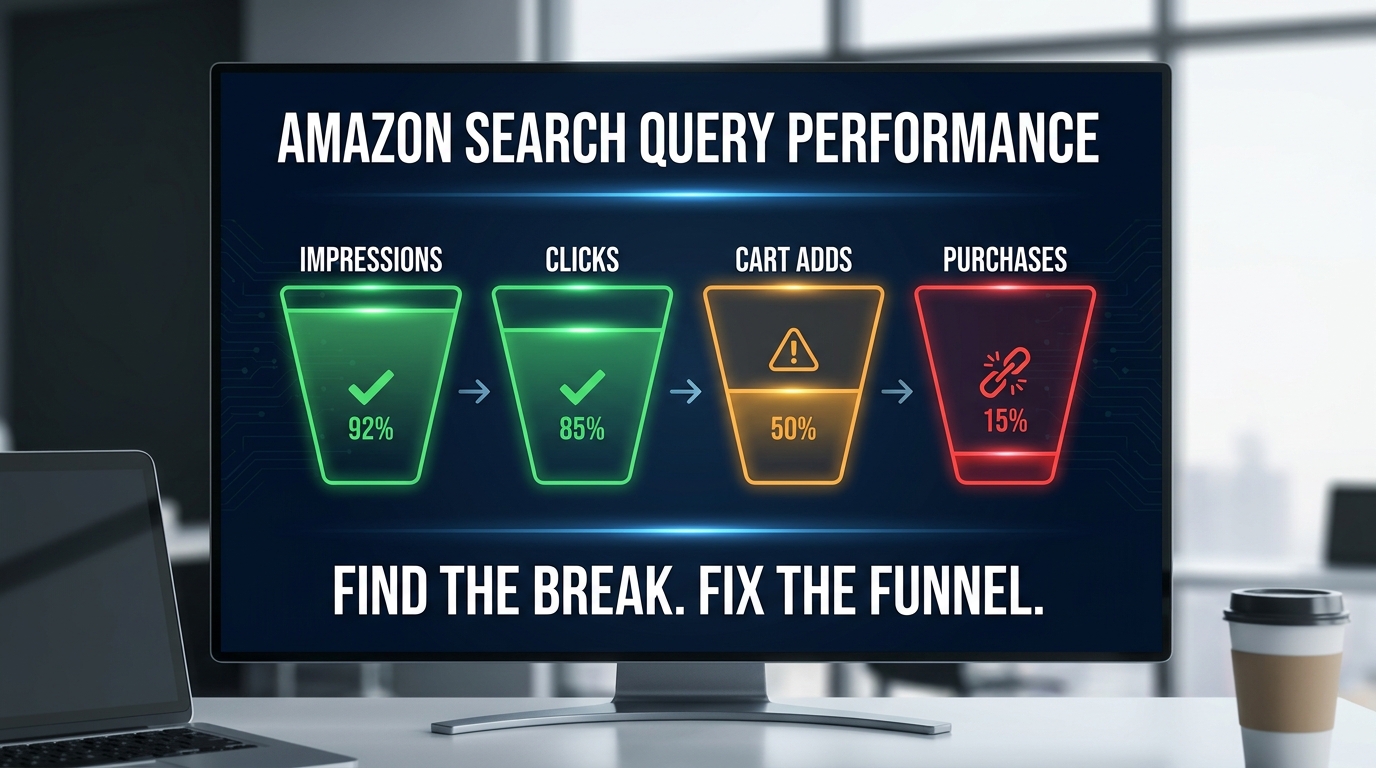
Most sellers open the Search Query Performance report looking for keywords. They sort by volume, scan the top rows, and close the tab feeling vaguely informed. Then they wonder why their sales don’t move.
That misreading is costly. Amazon’s Search Query Performance report — available inside Brand Analytics under Seller or Vendor Central — is not a keyword discovery tool. Third-party platforms already handle that. What the SQPR provides is something far more specific and far more actionable: a staged funnel view of how each search query converts from impression all the way through to purchase, and where in that funnel your brand or ASIN is losing ground relative to the total market.
That distinction changes everything about how you use it. The sellers who treat SQPR as a volume report keep optimizing the wrong things. The ones who treat it as a funnel diagnostic find the actual bottleneck — whether it’s a visibility gap, a click-through failure, a listing conversion problem, or a checkout friction issue — and fix it surgically before throwing more ad spend at the problem.
This piece walks through a complete diagnostic framework for Amazon Search Query Performance in 2026: how to identify your specific funnel break points, how to interpret share metrics at both the brand and ASIN level, how to approach branded versus non-branded queries differently, and how to build a repeatable weekly workflow that keeps you acting on SQPR data instead of just reading it.
If your impression share, click share, or purchase share metrics aren’t where they should be — and you’re not entirely sure why — this is where to start.
What the Search Query Performance Report Actually Measures (and What It Doesn’t)
Before diagnosing problems, you need a precise picture of what the SQPR is actually telling you. Many sellers get into trouble because they conflate SQPR metrics with their overall sales data, or assume that what the report shows represents their complete picture of Amazon search.
The Four Funnel Stages
The report tracks four stages for each search query:
- Impressions: How many times your brand’s products appeared in search results for that query.
- Clicks: How many shoppers clicked through to a product detail page from those search results.
- Add-to-Cart: How many shoppers added the product to their cart after visiting the detail page.
- Purchases: How many shoppers completed a transaction.
Alongside raw counts, the report shows your share at each stage — meaning what percentage of the total market’s impressions, clicks, cart adds, and purchases went to your brand. Those share metrics are the diagnostic engine of the entire report. Raw counts tell you scale; share metrics tell you competitiveness.
Two Views: Brand and ASIN
The SQPR offers two analytical lenses. The brand-level view aggregates all of your ASINs for each query, making it useful for portfolio-level strategy and competitive positioning. The ASIN-level view breaks that down to an individual product, which is where surgical fixes happen. Both are available in weekly, monthly, and quarterly time frames. You’ll use both — but for different purposes, and at different moments in your workflow.
What the Report Doesn’t Capture
Equally important is understanding the SQPR’s blind spots. Research from practitioners who’ve cross-referenced SQPR data against actual sales figures — including internal testing on products with no external traffic sources — consistently finds that SQPR-attributed sales represent only a fraction of total sales. In some documented cases, SQPR accounted for as little as 17–25% of actual monthly sales volume for the same ASIN.
Why the gap? The report applies specific attribution logic that excludes certain purchase paths — repeat buyers, Subscribe & Save orders, purchases driven by product targeting ads in some contexts, and a range of other conversion paths that don’t flow cleanly through the search-to-click-to-purchase journey the report is designed to measure. It also excludes off-Amazon traffic entirely.
This doesn’t make the report less useful. It means you should use SQPR as a directional diagnostic tool, not an absolute revenue accounting system. The share metrics are reliable indicators of competitive position. The funnel ratios are reliable indicators of where friction exists. But never benchmark your total business health against SQPR purchase counts alone.
The Four Funnel Break Points and How to Identify Yours
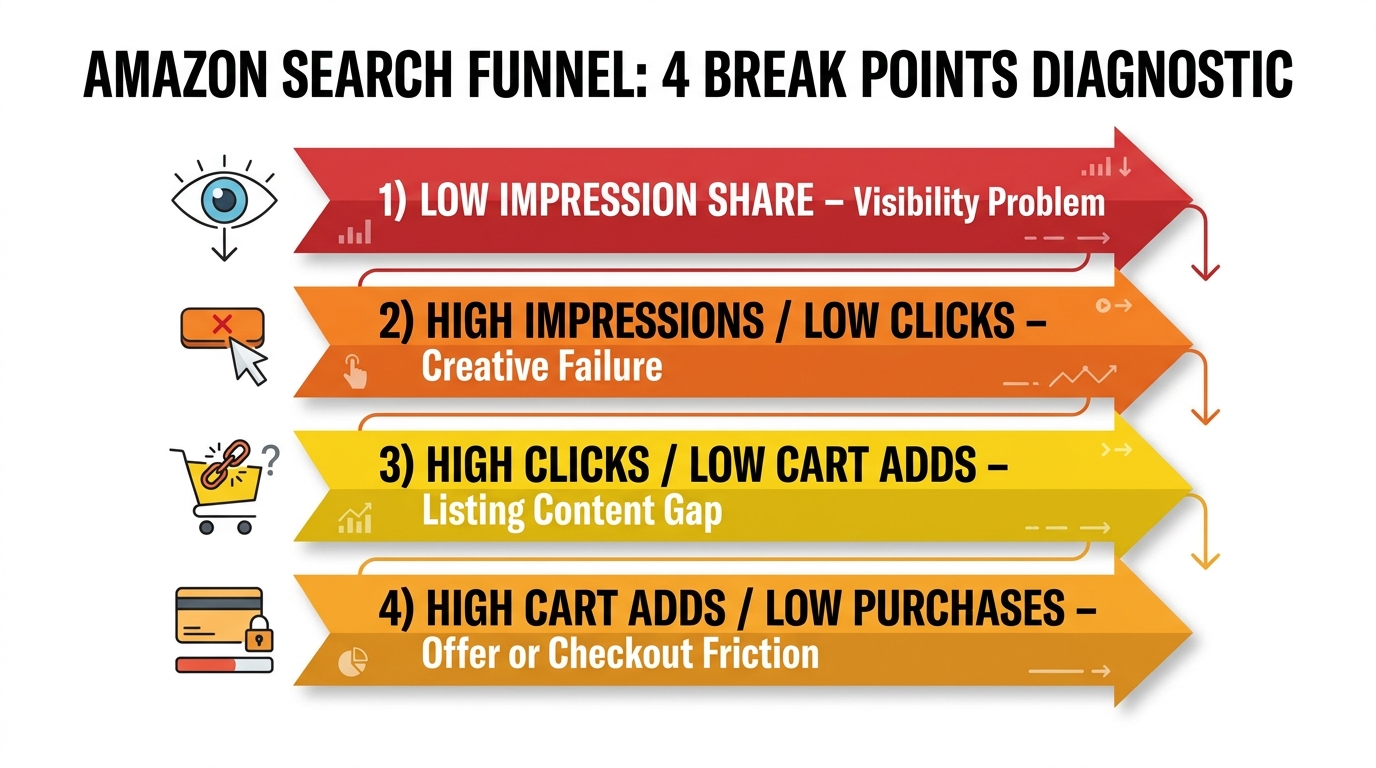
Every SQPR problem fits into one of four break-point patterns. Identifying which one you’re dealing with is the entire diagnostic game. Treat each pattern as a distinct failure mode with its own set of causes and fixes.
Break Point 1: Low Impression Share
If your impression share for a query is low relative to what you’d expect given your product’s relevance, you have a visibility problem. Your product isn’t appearing frequently enough in search results for that term — meaning shoppers never get the chance to click or buy.
The causes stack into three main buckets: indexing failures (Amazon hasn’t associated your listing with the query), ranking suppression (your organic rank for the term is too low to generate meaningful impressions), and advertising limitations (your bids or budgets are insufficient to win paid placements that would show up in impression counts).
The fix starts with verifying indexing. Use the backend search term check in Seller Central to confirm your listing is indexed for the query. If it’s not, the listing content needs updating — the term should appear in your product title, at least one bullet point, or the product description in a meaningful way. If you’re indexed but ranking is low, that’s a longer-term organic play that requires a combination of improved conversion rate on the page, review velocity, and targeted PPC investment to build sales history on that term. If the issue is purely advertising, the fix is more tactical: raise bids for high-intent queries where you’re indexed and converting, or expand your keyword match types to capture more impression volume.
Break Point 2: High Impression Share, Low Click Share
This is the creative and positioning failure. Shoppers are seeing your product in search, but they’re choosing a competitor over you. The click never happens, so all downstream metrics suffer regardless of how strong your listing is.
The SQPR data alone tells you this is happening. The cause requires looking at your search appearance critically: your main image, your title, your price, and your review count and rating — the five elements visible to a shopper before they decide whether to click. A main image that blends into competitor listings, a title that doesn’t match the intent behind the specific query, or a price that is noticeably higher than the alternatives shown on the same search page will all suppress click share even when impression share is strong.
This break point is a signal to test. Pull the query where the gap is most pronounced, look at the search results page from a shopper’s perspective, and honestly evaluate whether your listing’s visible elements stand out or blend in. Thumbnail differentiation, a competitive price point, and a four-star-plus rating are baseline requirements at this stage of the funnel.
Break Point 3: High Click Share, Low Cart-Add Share
Shoppers are choosing your listing from search, arriving at your detail page — and leaving without adding to cart. This is a listing content and relevance problem. The traffic is qualified enough to click; the product detail page is failing to persuade.
Common causes include a disconnect between the search query and your listing copy (the shopper expected something slightly different based on the query and felt misled by the detail page), thin or unconvincing content in bullet points and the product description, insufficient social proof (too few reviews or reviews that raise doubts about the exact use case), or images that don’t communicate key product attributes for that specific query’s intent.
The fix requires mapping specific queries to your listing content and asking whether what shoppers see after clicking matches what they searched for. For high-volume queries with this pattern, consider A/B testing your hero image, updating bullet points to more directly address the query’s intent, or adding lifestyle imagery that speaks to the specific use case.
Break Point 4: High Cart-Add Share, Low Purchase Share
This is the subtlest and often most frustrating break point. Shoppers are engaging deeply — they’re clicking, they’re adding to cart — but they’re not completing the transaction. This pattern points to offer or checkout friction.
Several forces can cause it: a price that feels uncompetitive when shoppers comparison-shop within their cart (Amazon regularly shows alternatives in the cart view), shipping speed or Prime eligibility concerns, a coupon or promotion that shoppers expected but didn’t find, or simply hesitation driven by not enough reviews or too many negative reviews about reliability. In some categories, payment or return policy concerns can also suppress this final conversion step.
The SQPR alone won’t tell you exactly which factor is responsible. But the cart-add-to-purchase gap is a signal to look hard at your pricing strategy, your Prime eligibility status, and your reviews — particularly any reviews that mention shipping, packaging, or product reliability. Small price reductions, adding a coupon, or improving FBA eligibility can sometimes close this gap faster than any listing change.
How to Read Query Volume Rank Without Being Fooled by Raw Numbers
One of the most persistent SQPR misreadings is treating query volume as the primary filter for where to focus. Sellers naturally gravitate toward high-volume queries because they represent more traffic. But volume and value are not the same thing — and in many cases, chasing the highest-volume terms is the precise reason brands stall.
What “Query Volume Rank” Actually Measures
The SQPR doesn’t show raw monthly search volume in the way a third-party tool would. It shows a Search Query Score — a relative ranking of how frequently a term is searched within the report’s scope. This score indicates relative importance but should not be read as an absolute volume figure you can compare across categories or time periods without context.
The practical implication: two queries with similar Query Volume Rank scores may generate wildly different actual purchase volumes depending on conversion rates across the category. A broad, high-frequency query like “water bottle” may rank highly but carry diffuse purchase intent. A more specific query like “insulated stainless water bottle 40oz with handle” may rank lower in volume but carry far sharper intent — and correspondingly stronger purchase share for the brands that show up well for it.
The Long-Tail Advantage That Most Brands Miss
The volume-first mindset causes brands to underinvest in the long tail, where some of the highest purchase-share opportunities sit. Lower-volume queries are less contested. Fewer competitors are bidding aggressively on them, fewer brands have optimized their listings specifically around them, and shoppers who use them tend to be further down the purchase decision path.
In practice: when you sort SQPR data by your purchase share rather than query volume, a different set of queries rises to the top. Some of them will be terms you’ve never explicitly targeted. Some will be queries where you’re already winning a disproportionately high share of purchases relative to impressions — which means your listing is highly relevant for that intent, and doubling down on it through both organic optimization and targeted PPC is a high-return investment.
The Isolation Approach: Volume Tier Segmentation
Rather than sorting by volume alone, try segmenting queries into three tiers — high, medium, and low volume — and then analyzing share metrics within each tier separately. This reveals which tier is responsible for your strongest competitive position, which tier has the largest gaps, and where the best return on optimization effort lies. Often, a mid-tier query with a large impression-to-purchase share gap represents a better optimization target than a top-tier query where the market is brutally competitive and marginal share gains are expensive to win.
Branded vs. Non-Branded Query Segmentation: Two Different Battlefields
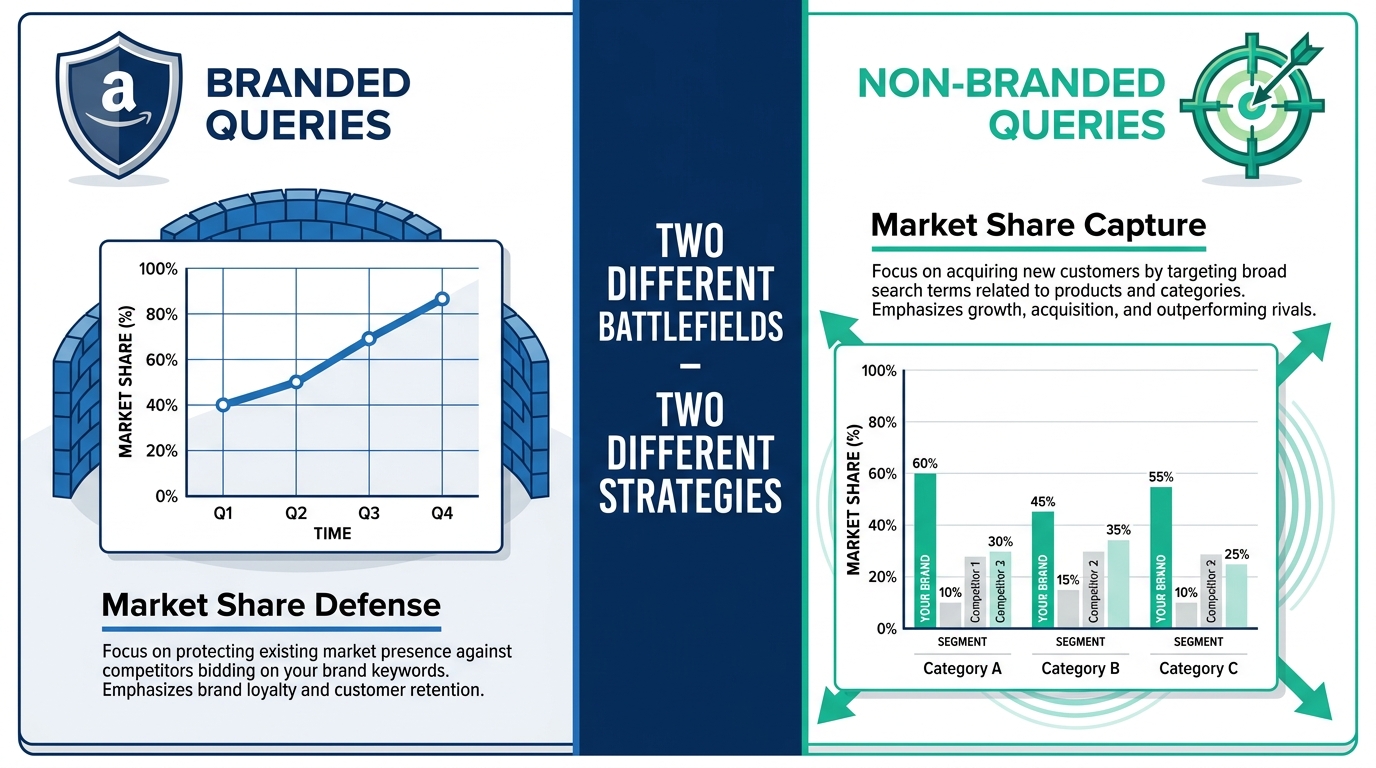
Branded and non-branded queries represent fundamentally different competitive dynamics. Treating them identically in your SQPR analysis leads to misdirected effort and misread results.
Branded Query Performance: What It Signals About Brand Health
When a shopper types your brand name into Amazon search, they’ve already made a preliminary decision about who they’re looking for. Your impression share, click share, and purchase share on branded queries is therefore a measure of how effectively you’re serving already-interested shoppers — and how much competitor interference is diluting that capture.
A healthy branded query profile shows high impression share (you appear prominently when your brand name is searched), high click share (shoppers are choosing your listing, not a competitor’s sponsored placement or Amazon’s own suggestion), and high purchase share. When branded click share drops, that’s often a sign that competitors have begun bidding on your brand terms in Sponsored Products campaigns, or that Amazon is surfacing sponsored alternatives prominently. It’s a defensive alert, not an organic ranking problem.
For branded terms, the primary strategy is protection: run your own Sponsored Brand campaigns and Sponsored Product campaigns on your brand name to crowd out competitors, ensure your listings are the top organic result, and monitor branded query metrics week over week as an early-warning system for competitive incursion.
Non-Branded Query Performance: Where Market Share Is Actually Won
Non-branded queries — category terms, product feature searches, use-case searches — represent the market beyond your existing customer base. These are the terms where shoppers have not yet decided which brand to buy from. They’re in discovery mode. And this is where brand growth at scale actually happens.
Non-branded query performance in the SQPR should be read as a market capture metric. How much of the category’s impression share are you earning on generic terms? How much of the purchase share? These numbers reflect your competitive standing against the entire category, not just competitors who directly target your brand.
A common pattern among scaling brands: impression share on non-branded terms is acceptable, but purchase share is significantly lower than the market average. This usually means the brand is achieving visibility through PPC, but the listing itself isn’t converting well enough against established competitors once shoppers arrive. The fix is almost always listing-side — not more advertising.
Separate Your Analysis, Separate Your Strategies
The most actionable approach is to filter your SQPR export into two separate tabs: branded and non-branded. Analyze your funnel share metrics for each in isolation. Set different benchmarks and different KPIs for each. A 90% purchase share on branded terms might be excellent in one category and mediocre in another. A 5% purchase share on a high-volume non-branded term might represent an enormous opportunity or a realistic ceiling depending on how competitive that space is.
Running both simultaneously as distinct strategic tracks — defense on branded, offense on non-branded — gives you a clearer picture of where effort should go than a combined analysis ever will.
ASIN-Level vs. Brand-Level View: When to Use Which
The SQPR’s two-view structure isn’t just a display option — it’s designed for two genuinely different analytical purposes. Mixing them up leads to both over-generalizing problems that are actually ASIN-specific, and over-obsessing about individual product metrics when the strategic picture is really a portfolio issue.
Brand-Level View: Portfolio Positioning and Competitive Benchmark
The brand-level view aggregates all of your ASINs for each query. This is where you start when you want to understand your brand’s overall competitive position in a search category. It answers questions like: On the top 50 queries most relevant to our catalog, what share of impressions, clicks, and purchases are we capturing compared to the market? Are there high-volume queries where we have near-zero presence? Are there emerging queries where our purchase share is growing faster than our impression share — a leading indicator of improving relevance?
Use the brand-level view for monthly and quarterly strategic reviews, for identifying where to focus catalog expansion, and for presenting competitive landscape data to stakeholders or clients. It’s a macro lens.
ASIN-Level View: Surgical Diagnosis and Testing
Once the brand-level view surfaces a problem query — low click share, underperforming purchase share — you switch to the ASIN-level view to understand which specific product is responsible and what’s driving the gap. The ASIN view lets you see whether one ASIN is cannibalizing another on the same query, whether a new product launch is gaining traction on a target query, or whether a legacy ASIN has seen its purchase share collapse without obvious cause.
The ASIN-level view is also where you track the results of specific optimization changes. If you updated a main image for a product targeting a specific query, the ASIN-level weekly data will show whether click share improved in the weeks following the change — providing feedback that the brand-level view dilutes across the catalog.
Choosing the Right Time Granularity
Both views offer weekly, monthly, and quarterly data. The right cadence depends on the question you’re asking. Weekly data is noisier — individual weeks can show variance driven by promotional activity, seasonal factors, or competitive moves that don’t represent trends. But weekly data is the right tool for detecting sudden changes: a competitor’s price drop that collapses your click share on a key query, a listing change that immediately moves your cart-add rate, or a PPC budget adjustment that shifts impression share.
Monthly data is the right anchor for optimization decisions. It smooths out noise while still showing changes fast enough to act on. Most experienced practitioners use a rhythm of weekly data for alerting (flagging meaningful changes) and monthly data for decision-making (determining what to actually change and why). Quarterly data is reserved for category-level positioning reviews and long-term trend identification — not for week-to-week operations.
The Impression Share Fix: Getting Organic and Paid to Work Together
Low impression share is the most fundamental SQPR problem — and the one that takes the longest to fix sustainably. It’s also the break point where sellers most often reach for the wrong solution: simply raising PPC bids without addressing the underlying relevance issue that’s suppressing organic visibility.
First, Verify Indexing
Before any bid or budget adjustment, confirm that Amazon has indexed your listing for the target query. The simplest check: search for your ASIN combined with the keyword in Amazon’s search bar (example: ASIN B0XXXXXX “yoga mat thick”). If your product doesn’t appear in the results, you’re not indexed for that term, and bidding on it will be inefficient or ineffective.
Fixing an indexing gap requires adjusting your listing copy. The target term should appear in your product title, at least one bullet point, or the product description in a natural and relevant way. Backend search terms (the hidden keyword fields in Seller Central) also feed indexing, but their weight has diminished over time. Front-end listing content carries more relevance signal for Amazon’s algorithm in 2026 than backend fields alone.
Using PPC as a Rank Signal, Not Just a Traffic Channel
There is a meaningful relationship between paid visibility and organic ranking on Amazon. When a product receives sales velocity on a specific keyword — regardless of whether those sales came from organic or paid search — Amazon’s algorithm registers that demand signal. Sustained conversion-positive PPC on a target query can, over time, lift your organic rank for that query, which in turn grows impression share without ongoing ad spend.
This is why the most effective impression-share recovery strategies don’t treat PPC and organic as separate channels. They use targeted Sponsored Products campaigns on priority queries to build sales velocity while simultaneously improving listing relevance and conversion rate so that every impression — paid or organic — converts at a rate that reinforces the rank signal.
The sequence matters: fix indexing first, then improve listing conversion rate, then invest in PPC to drive volume. Investing in PPC before the listing is optimized wastes spend because low conversion rates on those paid impressions can actually signal low relevance to the algorithm rather than building rank.
Diagnosing Budget vs. Bid vs. Relevance as the Root Cause
Low impression share on paid placements specifically can stem from three distinct causes, each with a different fix. A bid that’s too low relative to competitors means your ads rarely win the auction. A budget that runs out before peak shopping hours means you’re invisible during the times that matter most. And low Quality Score (Amazon’s assessment of your listing’s relevance to the query) means you pay more per impression even when you win.
Check campaign reports in Seller Central for “impression share lost to bid” and “impression share lost to budget” signals. Most advertising platforms, including Amazon’s, provide some form of this data in the campaign view. Use it to distinguish between a bidding problem and a budget problem before changing both simultaneously — changing one variable at a time gives you cleaner data on what’s actually working.
The Click Share Fix: What Your Main Image and Title Are Getting Wrong
High impression share with low click share is a creative problem, and it’s often more fixable than impression share gaps — sometimes within days of making the right change. The diagnosis is straightforward. The solution requires honest creative assessment and willingness to test.
The Five Elements That Drive Clicks from Search
When a shopper sees your product in search results, they make their click decision based on five elements before they ever reach your detail page: the main product image, the title (particularly the first 80–100 characters visible on desktop, and fewer on mobile), the price, the review count, and the star rating. In that order of visual priority.
Most click share problems trace back to main image issues or price positioning. A main image that doesn’t clearly show the product’s differentiating features at thumbnail size, uses a cluttered background, or simply looks visually similar to dozens of competitor images on the same search page will be passed over — regardless of how good your listing content is behind the click.
Examine your main image not at full resolution, but at the actual thumbnail size it appears in search results on both desktop and mobile. Does the product stand out? Does the key value proposition read clearly even at that reduced size? If competitors are using white backgrounds and you are too, consider whether a styled background or a lifestyle element in the main image would create visual separation — within Amazon’s image guidelines. If competitors use lifestyle backgrounds and you’re purely white, the clean thumbnail may actually stand out.
Title Optimization for the Specific Query
Title relevance matters not just for indexing but for click-through. When a shopper searches “yoga mat extra thick 1/2 inch” and your title says “Premium Fitness Mat for Exercise,” the mismatch reduces click confidence even if your product is exactly what they need. The shopper doesn’t immediately see the specific attribute they searched for.
The click share data in SQPR makes it possible to diagnose this query by query. For the specific terms where click share is lowest, review your title’s visible portion and ask whether it addresses the intent behind that specific query. Consider building separate A/B test variants for high-priority queries if your title is currently optimized for a different primary term.
Price as a Click Driver
Price doesn’t just affect conversion — it affects click decisions too. When shoppers scan a search results page, they often look at prices before choosing which listing to click. Being 15–20% more expensive than the comparable offerings shown on the same results page will suppress click share even when your product is objectively superior.
This doesn’t mean competing on price alone. But it does mean that if SQPR shows a click share problem and your price is noticeably above competitors for the queries in question, pricing deserves a look before assuming the issue is purely creative.
The Conversion Fix: Why Shoppers Are Leaving After They Click
The click share fix gets shoppers to your page. The conversion fix is what keeps them there and moves them to purchase. Two distinct sub-problems live within the conversion stage — the gap between clicks and cart adds, and the gap between cart adds and purchases — and they have different causes and different solutions.
Clicks to Cart Adds: The Listing Persuasion Problem
If shoppers are clicking but not adding to cart, your detail page isn’t making the sale. This is almost always a content and relevance problem. The listing either doesn’t address the specific concern or use case the shopper arrived with, doesn’t provide enough credibility signals to justify the price, or fails to communicate the product’s key benefits in a compelling way within the first scroll.
The content elements that most directly drive add-to-cart behavior are the hero image (which should be compelling enough to reinforce the click decision), the title (which should confirm the product is exactly what was searched), the bullet points (which should address the top three to five questions a new shopper would have), and the review section. A listing with fewer than 20 reviews, or with a rating below four stars, will see cart-add rates significantly below what the click share would otherwise support.
Beyond copy, video content on the detail page has shown consistent add-to-cart lift in categories where product experience is hard to convey through images alone. If your SQPR shows strong click share but weak cart adds for a product in a hands-on category — kitchen tools, fitness equipment, personal care — a short product demonstration video addressing the most common pre-purchase questions is one of the highest-leverage investments you can make.
Cart Adds to Purchases: The Offer and Trust Problem
When the gap lives between cart adds and purchases, the shopper has already decided they want the product — but something is preventing them from completing the transaction. At this stage of the funnel, small factors carry outsized weight.
Prime eligibility and shipping speed are frequently underestimated here. Amazon shoppers have been conditioned to expect fast, free shipping, and a product that’s not Prime-eligible — or that shows a longer-than-expected delivery window — often gets abandoned in the cart in favor of a Prime-eligible alternative. If your SQPR shows a cart-to-purchase gap and you’re not Fulfilled by Amazon on the relevant ASIN, that should be the first variable to address.
Price comparison within the cart is another factor. Amazon actively shows alternative product suggestions in the cart view, and shoppers who see a cheaper or better-rated alternative there will sometimes switch. Promotional tactics — a coupon clipped on the listing, a small price reduction, or a Subscribe & Save discount for consumable products — can close this gap by creating a sense of finality around the purchase decision.
Competitive Purchase Share Gap Analysis: Finding Where You’re Actually Losing
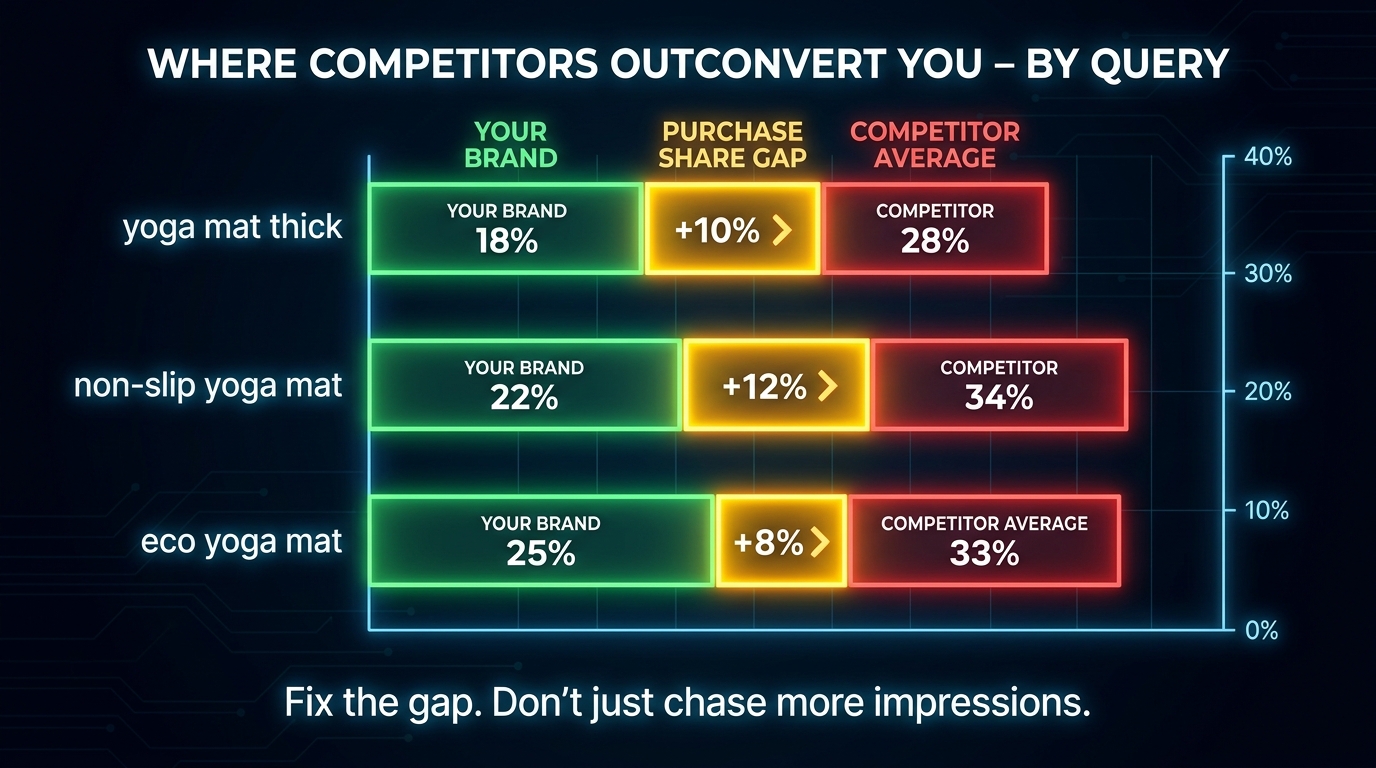
The most strategically valuable use of SQPR data isn’t looking at your own metrics in isolation — it’s identifying where competitors are converting better than you on queries that should be yours to win. This is what purchase share gap analysis reveals.
How to Calculate Your Purchase Share Gap
For any given query, the SQPR shows your brand’s purchase share as a percentage of all purchases made by shoppers who searched that term. The remainder is split among all other brands in the market. If you have 8% purchase share on a high-volume query and your impression share is 22%, the gap tells you that you’re capturing significantly less of the final transactions than your visibility should theoretically produce.
Compare impression share to purchase share systematically across your top 20–30 priority queries. Calculate the ratio for each (purchase share ÷ impression share). A ratio approaching or exceeding 1.0 means you’re converting at or above the rate your visibility would suggest — a strong signal. Ratios well below 1.0 — say, 0.3 or 0.4 — mean you’re significantly underconverting relative to your visibility. These are your highest-priority optimization targets because the traffic is already there; the friction is in the funnel.
Offensive vs. Defensive Gap Strategies
Not all purchase share gaps deserve the same response. Some gaps exist because competitors genuinely have a better product for that specific query’s intent — better pricing, stronger reviews, more relevant features. Chasing share against a structurally superior competitor on their strongest query is expensive and often futile. Instead, look for gaps on queries where your product is objectively competitive, where the conversion failure is likely a listing or PPC issue rather than a product issue, and where the market total purchase volume is large enough to justify the investment.
Defensive gap management is the other side of the coin. Queries where you have high purchase share are worth protecting aggressively. If you hold 35% purchase share on a high-intent long-tail query, that’s a position competitors will target. Monitor branded and non-branded queries where your purchase share is strong and invest in maintaining that position through continued listing quality, pricing discipline, and sustained PPC coverage to prevent erosion.
Tracking Gap Trends Over Time
A single SQPR snapshot tells you where you stand. Tracking purchase share gap over three months of monthly data tells you whether you’re gaining or losing ground — and whether your optimization efforts are moving the needle. Build a simple tracking sheet that records impression share and purchase share for your top 20 queries each month. Watch the ratios. If the gap is narrowing, the changes you made are working. If it’s widening despite optimization effort, you may be fighting a structural disadvantage that requires a product or pricing response rather than a listing response.
Building a Weekly SQPR Workflow That Actually Gets Used
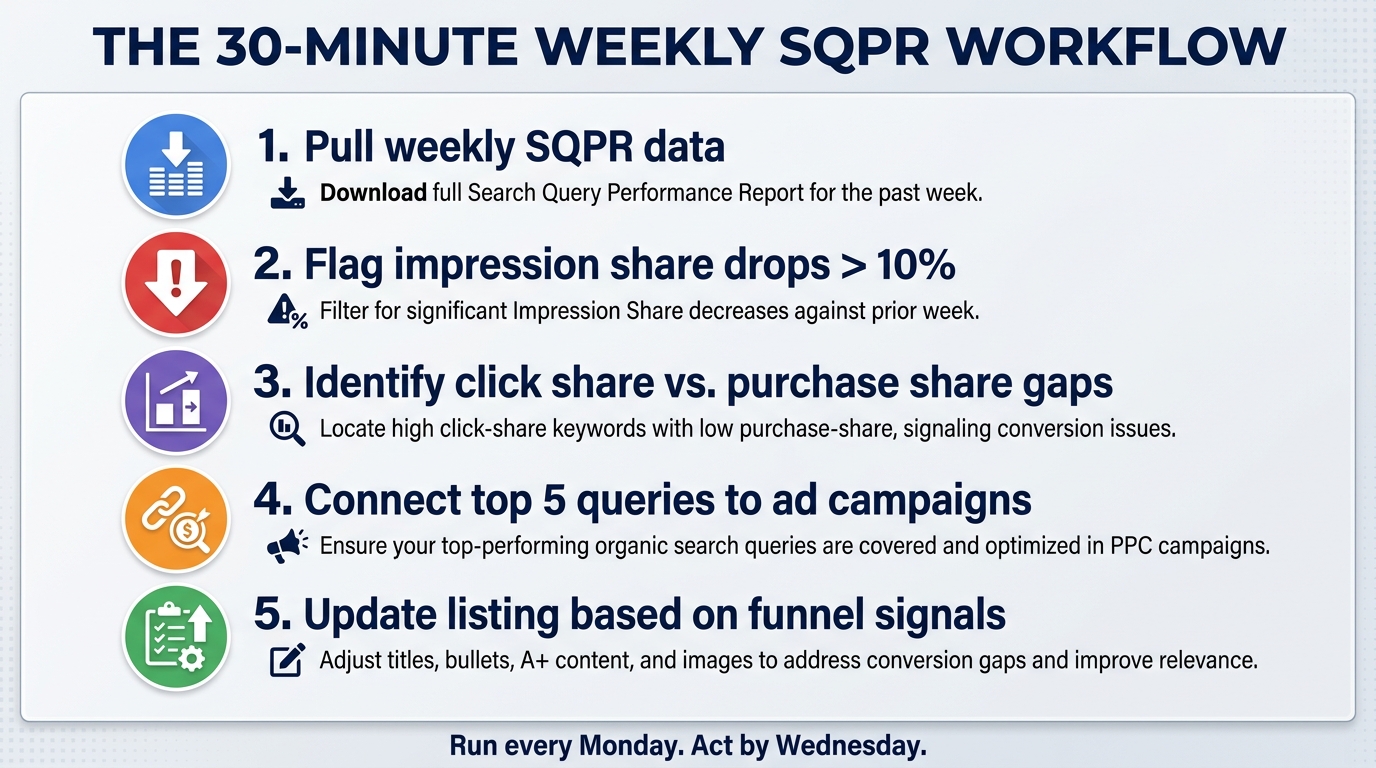
The SQPR is only as valuable as the cadence you build around it. Sellers who check it intermittently — quarterly, or only when something seems wrong — are getting the least value from the most detailed first-party data Amazon makes available. A tight weekly workflow turns this data into a compounding competitive advantage.
The 30-Minute Monday Review
Set aside thirty minutes every Monday morning to run a structured SQPR review. The goal isn’t to analyze everything — it’s to flag the changes that matter and set the week’s optimization priorities before ad budgets run and listing decisions solidify for the week.
Pull the previous week’s SQPR data at the brand level first. Sort by impression share change (comparing to the prior week or a defined baseline). Any query where impression share dropped more than 10 percentage points week-over-week is worth flagging immediately — this can signal a competitor launched a campaign, your organic rank slipped, or a budget ran out during a high-demand day. Then sort by purchase share and flag any query where your purchase-to-impression ratio dropped below your established threshold. These are the break points that need action this week, not next month.
Connecting SQPR Flags to Campaign Actions
Every SQPR flag should have a corresponding action in your advertising campaigns or listing management workflow. Impression share drops on key queries trigger a bid check: are campaigns active, are they winning the auction, did a budget run out? Click share drops on queries where impression share held steady trigger a creative review: has a competitor changed their main image or dropped their price? Purchase share drops trigger a listing review: did a competitor gain reviews, add a video, or change their pricing in a way that shifted conversion?
The connecting tissue between SQPR data and ad campaigns is critical. Many sellers analyze SQPR in one context and manage PPC in another, and the two never inform each other. The most effective operators build a shared log where every SQPR flag generates a timestamped action note, and every campaign change is logged with the SQPR context that prompted it. This makes it possible to close the feedback loop — to see, two or three weeks later, whether the action taken in response to a SQPR signal actually moved the metric that triggered it.
Monthly Deep Dive Structure
The weekly review is a maintenance cadence. Once a month, schedule a deeper session — 90 minutes to two hours — using monthly SQPR data. This is where you conduct your purchase share gap analysis, reassess which queries deserve more investment, evaluate whether new queries have emerged in your category, and decide whether any listing optimizations are needed. The monthly deep dive informs the following month’s PPC strategy, the following month’s listing test schedule, and any product development insights worth flagging.
Quarterly, aggregate the monthly data to assess category-level trends: is your overall market share growing or contracting? Are there new query patterns suggesting shifting shopper intent in your category — new use cases, new feature attributes that shoppers are increasingly searching for? The quarterly view is where product strategy and search strategy intersect.
The Five Most Expensive SQPR Mistakes Sellers Are Still Making in 2026
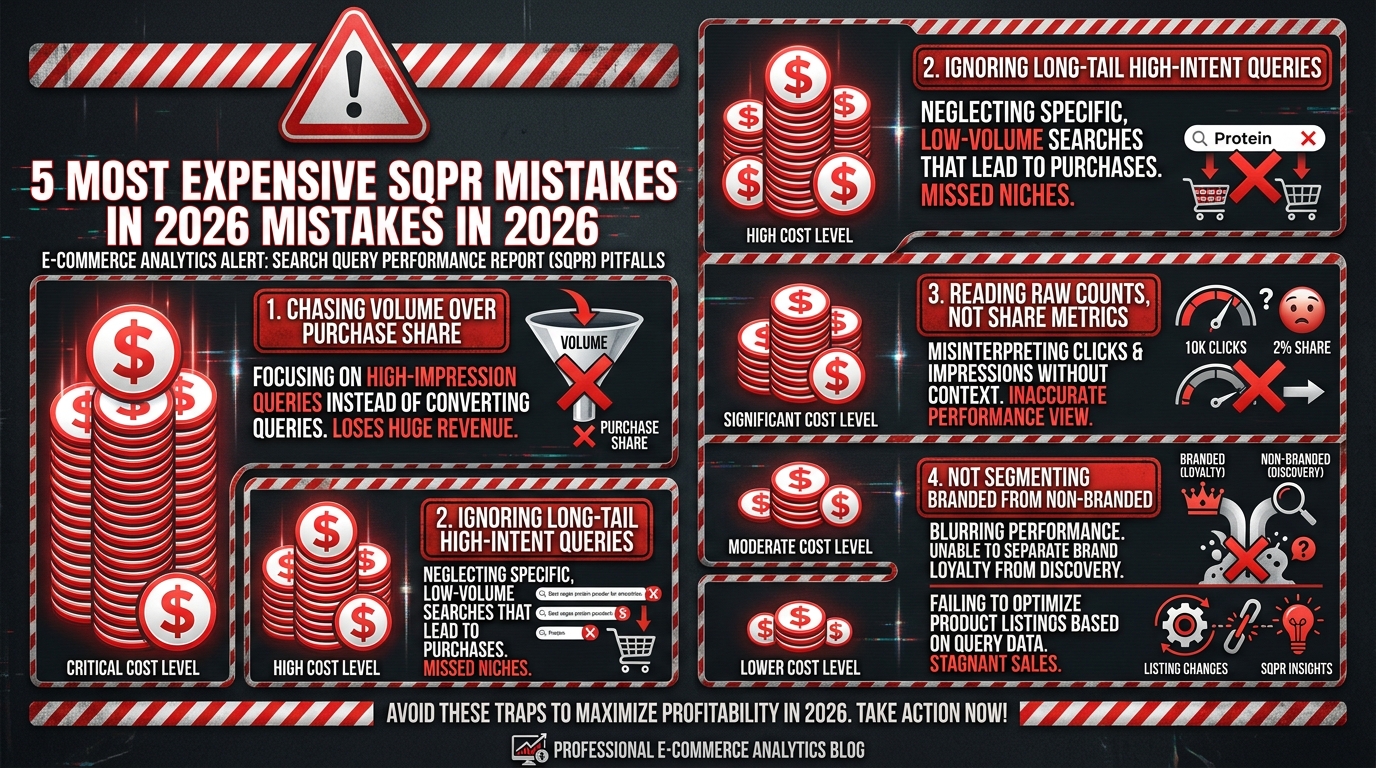
Despite SQPR being available since 2022, a set of persistent misreadings continue to cost sellers real revenue in 2026. These aren’t beginner mistakes — experienced sellers make them too, often because habits formed with older data tools haven’t been updated to match what SQPR uniquely provides.
Mistake 1: Chasing Volume Over Purchase Share
Sorting SQPR by query volume and targeting the top results is the single most expensive mistake sellers make with this data. High-volume queries attract the most competition, cost the most to advertise on, and often carry the most diffuse purchase intent. Brands that have the strongest SQPR-driven results focus on purchase share — finding queries where they’re winning actual transactions at a disproportionate rate, then defending and expanding those positions. Volume is context; purchase share is the real competitive signal.
Mistake 2: Treating SQPR as a Keyword Tool Rather Than a Funnel Tool
SQPR is not for keyword discovery. It’s for funnel diagnosis. Using it to find new keywords to add to campaigns — when you could use it to identify why existing keywords are leaking at click or conversion — is a fundamental misuse. The most valuable insight the report provides isn’t “here are more terms to target.” It’s “here is exactly where in the funnel your current terms are failing.”
Mistake 3: Reading Raw Counts Instead of Share Metrics
If your SQPR shows 10,000 impressions on a query and you celebrate, but the market total for that query was 500,000 impressions, your 2% impression share is not a good result — it’s a visibility problem. Raw counts are almost meaningless without market context. Share metrics are the only numbers that tell you how competitive your performance actually is. This is the SQPR’s fundamental insight that many sellers still miss: it’s a share-of-market report, not a performance volume report.
Mistake 4: Not Segmenting Branded from Non-Branded
Aggregating branded and non-branded queries into a single analysis produces misleading averages. Branded queries naturally have higher click and purchase share (shoppers are already looking for you). Mixing them with non-branded queries makes your competitive performance on generic terms look better than it is. Worse, it obscures the branded defense signal — a drop in branded click share that indicates competitor conquest campaigns is invisible in an aggregate view.
Mistake 5: Never Connecting SQPR Insights to Listing Changes
The most common SQPR failure mode isn’t misreading the data — it’s reading the data correctly and then doing nothing with it. Sellers identify a click share gap, acknowledge it’s probably a main image issue, and return to the same image for another month before the quarterly review comes around. SQPR data is only valuable if it triggers a concrete action: a listing test, a PPC adjustment, a pricing change, a content rewrite. Build a direct pipeline between SQPR flags and your optimization task queue. Every week’s review should produce at least two to three specific actions with an owner and a deadline. Without that pipeline, SQPR is just an interesting dashboard that doesn’t move your metrics.
What Consistent SQPR Users Do Differently — and What That Means for 2026
The sellers and brands that treat SQPR as a core operating tool — not an occasional reference — share a few consistent practices that separate their results from the field. They analyze share metrics first, not volume. They segment branded from non-branded from the moment they open the report. They connect every SQPR flag to a specific action within 48 hours. And they track metrics over time in their own tracking systems rather than relying solely on Amazon’s in-dashboard snapshots.
In 2026, the competitive advantage from SQPR comes less from having access to it — all brand-registered sellers do — and more from operating at a faster cycle time than competitors. A seller who reviews SQPR weekly and acts within two days outpaces a competitor who reviews it monthly and acts two weeks after that. Over six months, that cadence difference compounds into a meaningful separation in organic rank, click share, and purchase share on the queries that drive most of the revenue.
The diagnostic framework isn’t complex. It requires discipline more than sophistication: consistently identifying which of the four break points is active for each priority query, applying the right fix for that specific break point, tracking whether the fix moved the metric, and cycling through that process with a frequency that doesn’t give competitors time to consolidate gains.
Amazon’s first-party data is, by definition, more accurate for Amazon than any third-party approximation. SQPR is the best expression of that data for search performance. The sellers who learn to read it as a diagnostic tool — not a reporting snapshot — will consistently diagnose problems faster, fix the right things, and protect the search positions that compound into long-term business value.
Key Takeaways
- Treat SQPR as a funnel diagnostic, not a keyword tool. The four stages — impressions, clicks, cart adds, purchases — each point to a different category of problem and a different fix.
- Share metrics are the only numbers that matter. Raw counts are context; impression share, click share, and purchase share are the competitive signals worth tracking week over week.
- Identify your break point before spending money. Throwing PPC budget at a listing with a conversion problem won’t fix the conversion problem — it just makes the break point more expensive.
- Separate branded from non-branded queries. They require different strategies, different KPIs, and different optimization responses. Never analyze them together.
- Use ASIN-level view for surgical fixes, brand-level view for portfolio strategy. Match the analytical lens to the question you’re trying to answer.
- Build a weekly workflow with a direct action pipeline. Insights without actions are just reading. The competitive advantage comes from the speed of response, not the sophistication of the analysis.
- Track purchase share gap over time. A single SQPR snapshot is a temperature reading. Three months of monthly data is a trend line — and trend lines are what strategy is built on.
- Long-tail queries with high purchase share deserve more investment than high-volume terms with thin share. Volume is noise; purchase share concentration is signal.