

Every January, Amazon sends out its fee update notices. Every January, sellers scan the changes, nod at the modest numbers, and assume the impact will be minor. In 2026, that assumption is costing sellers real money — not because any single fee change is catastrophic, but because the cumulative architecture of Amazon’s cost structure has fundamentally changed.
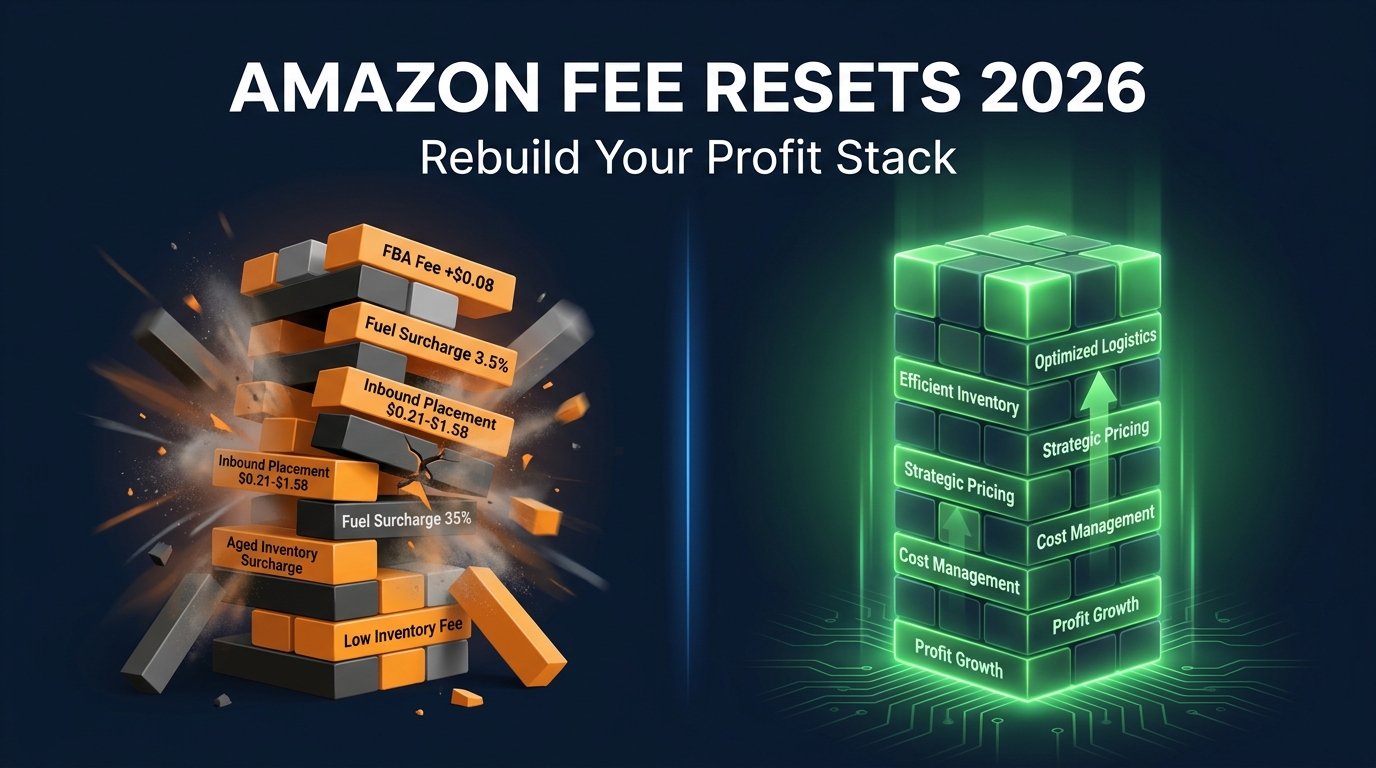
The headline number is seductive in its smallness: an average FBA fulfillment fee increase of about $0.08 per unit, effective January 15, 2026. Amazon was quick to note that this represents less than 0.5% of an average item’s selling price. At face value, that sounds manageable. At scale, once you layer in the 3.5% fuel and logistics surcharge added April 17, the tightened inbound placement fees, the accelerated aged inventory surcharge triggers, and the expanded low-inventory-level fee rules — the true per-unit cost increase for many sellers runs anywhere from $0.30 to over $1.50 per unit.
This article isn’t about panicking over fee changes. It’s about something more useful: building a profit stack that is structurally resilient to the way Amazon now charges for access to its fulfillment network. That means auditing what you’re actually paying at the SKU level, engineering down the fees you can control, and making deliberate decisions about the ones you can’t. What follows is a complete, data-driven framework for doing exactly that — from the fee ledger through to a 90-day rebuild roadmap.
The Complete 2026 Fee Ledger — Every Line Item That Changed
Before you can rebuild anything, you need an accurate read of what actually shifted. Amazon’s fee communications tend to lead with the most palatable number and bury the compounding charges. Here is every meaningful change that took effect in the first half of 2026 for US-based FBA sellers.
FBA Fulfillment Fees: The Foundation Layer
The base FBA fulfillment fee increase of approximately $0.08 per unit on average (effective January 15, 2026) is real but asymmetric across size tiers. Standard-size items priced in the $10–$50 band feel the increase most consistently. Small standard-size items at lower price points see smaller absolute increases; large bulky and extra-large items already carry high base fees and the absolute dollar increase is proportionally less significant — though those categories have their own exposure through dimensional weight recalculations.
What changed in the fee structure isn’t just the rate — it’s the price-banding overlay. Amazon introduced more granular price-tiered fee calculations for 2026, meaning the same physical product can now pay different fulfillment fees depending on which price band its sale price lands in. Sellers who straddle price band thresholds have an additional lever to manage.
The 3.5% Fuel and Logistics Surcharge
This is the charge that caught many operators off guard. Effective April 17, 2026, Amazon applied a 3.5% surcharge to all FBA fulfillment fees in the US and Canada. This extends to Multi-Channel Fulfillment (MCF) and Buy with Prime orders as of May 2, 2026. Critically, the surcharge is applied to the fulfillment fee, not the item sale price — so it compounds on top of the base fee, not the referral fee. On a $3.22 base FBA fee, that’s an additional $0.11. Across a catalog of thousands of units per month, this surcharge alone adds up to thousands of dollars in incremental costs with zero corresponding operational change on the seller’s side.
Inbound Placement Service Fees
Inbound placement fees represent one of the more complex changes in the 2026 fee structure. When Amazon receives your shipment and redistributes it to fulfillment centers (FCs) across its network, it now charges a per-unit fee for that redistribution service — unless you opt into distributed shipment programs where you send smaller quantities to multiple FCs yourself. The per-unit cost of inbound placement ranges from approximately $0.21 to $1.58 per unit depending on the product size tier and the degree of distribution you opt into.
Sellers who send full pallets to a single FC — the simplest inbound approach — bear the highest placement fees. Sellers who split shipments across multiple FCs themselves can reduce or eliminate this charge but absorb higher freight complexity and costs in the process. The math works differently for every catalog, which is why this fee demands individual SKU-level analysis rather than a blanket policy.
Aged Inventory Surcharge: The Clock Moved Forward
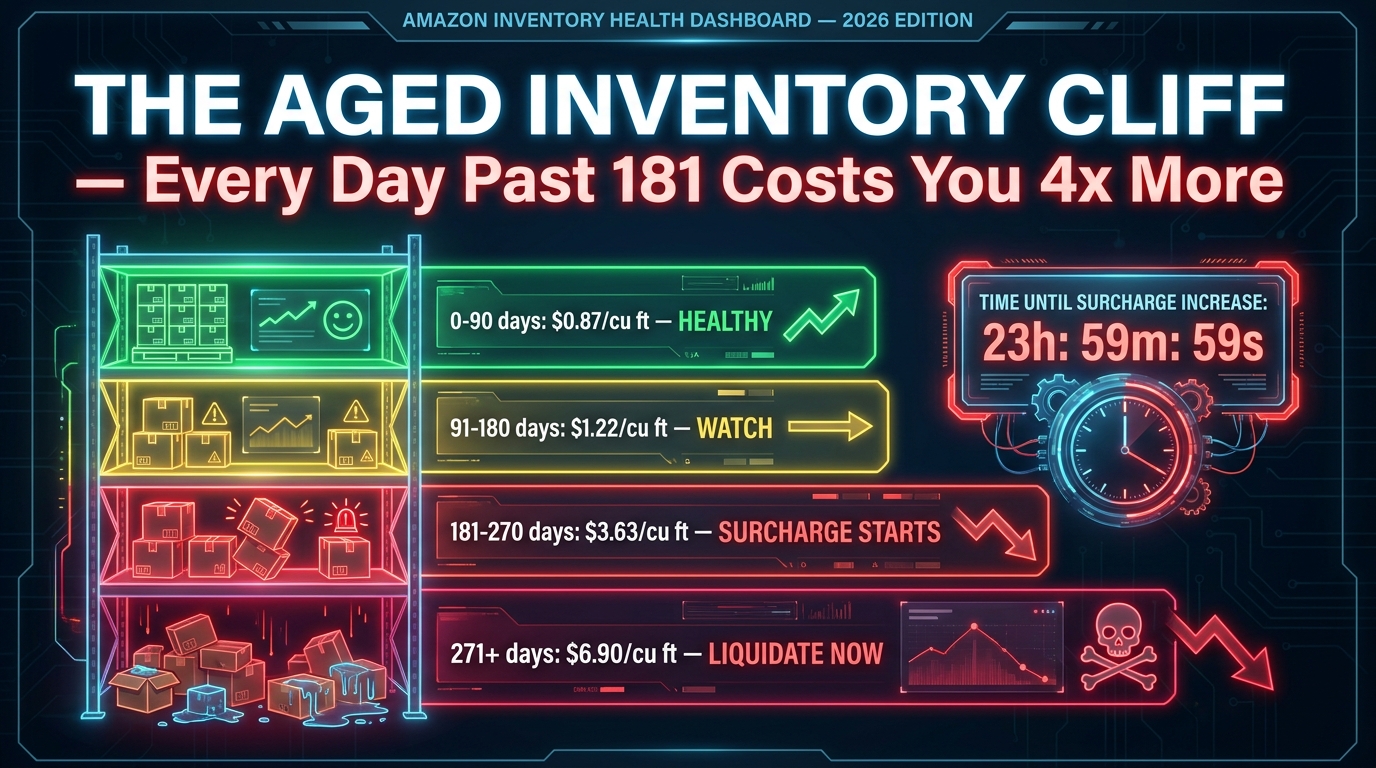
Amazon’s aged inventory surcharge structure was also tightened for 2026. The significant change: surcharges now trigger at 181 days rather than the previous 271-day threshold in some tiers. This means inventory that was historically “acceptable” in terms of storage age is now actively incurring penalty fees roughly three months sooner than it was in prior years. The cost escalation is steep — what costs $0.87 per cubic foot at 90 days can run $3.63+ per cubic foot in the 181–270 day range.
Low-Inventory-Level Fee
Amazon introduced expanded rules around the low-inventory-level fee in January 2026. If your in-stock rate falls below a threshold relative to your historical sales velocity, Amazon applies an additional per-unit fulfillment fee as a penalty for the network inefficiency created by stockouts. This fee is particularly punishing because it compounds with the standard fulfillment fee — and the sellers most likely to trigger it (those managing tight cash flow or navigating supply chain delays) are already the ones with the thinnest margins.
What Didn’t Change
Notably, referral fee percentages were not raised in the US for 2026. The standard referral fee structure — typically 8–15% depending on category — remains in place. For European sellers, 2026 actually brought a net fee reduction averaging £0.15/€0.17 per unit, a meaningful competitive boost in key categories and lower price tiers. US sellers don’t get that tailwind, but the stable referral fee base is at least one area of cost certainty in an otherwise variable picture.
The Layering Effect: Why “$0.08 More Per Unit” Is a $1.50 Problem
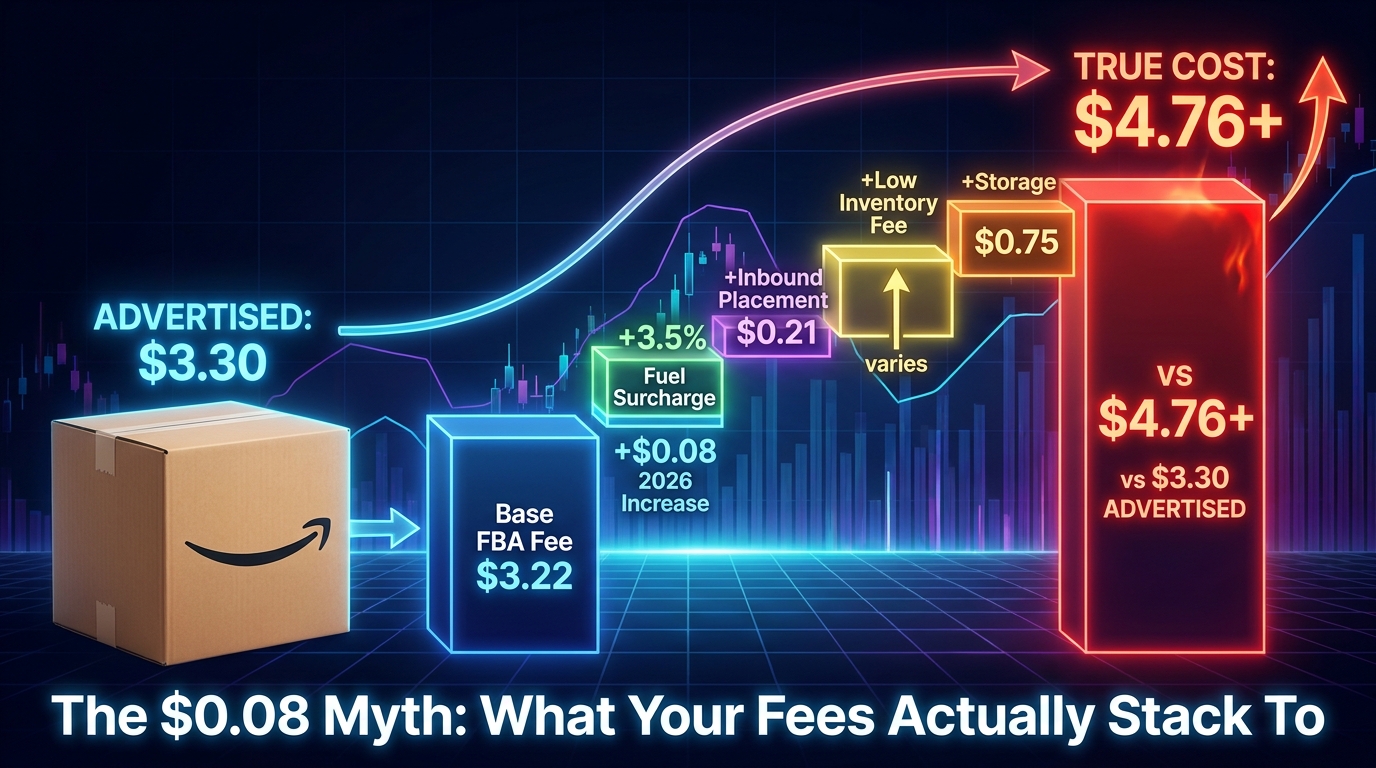
The “$0.08 per unit” framing is technically accurate as an average. It is not useful as a planning number. Here’s why: Amazon’s fee increases don’t operate in isolation. Each new charge layers onto the last, and the interaction effects produce a true per-unit cost increase that can be five to fifteen times the advertised headline number for many SKUs.
The Math of Fee Stacking
Take a hypothetical standard-size product selling at $34.99 in the Home & Kitchen category. Here is how the 2026 fee changes stack for a seller who sends full pallet shipments to a single FC and maintains moderate inventory levels:
- Base FBA fulfillment fee increase: +$0.08
- 3.5% fuel/logistics surcharge on base fee (e.g., $3.30 base × 3.5%): +$0.12
- Inbound placement fee (single FC, standard-size): +$0.27 (mid-range estimate)
- Pro-rated additional monthly storage (Q4 tightening): +$0.09
- Low-inventory fee exposure (seasonal dips): +$0.15 averaged across year
Total realistic fee increase: approximately $0.71 per unit. That’s nearly nine times the headline number — before accounting for any returns processing fee increases or promotional fee changes.
For a seller moving 2,000 units per month of this single SKU, the annual incremental fee exposure is approximately $17,040 per year — on a product line that might generate $40,000–$50,000 in annual profit under 2025 conditions. That’s a 34–43% reduction in profitability from fee changes alone, without any revenue decline.
Why Amazon’s Average Obscures Your Reality
Amazon’s “$0.08 average” is calculated across its entire product catalog, which includes many high-ASP items where the absolute fee increase is a rounding error against a $200 sale price. If your catalog is concentrated in the $15–$60 price range — where the vast majority of private-label and brand sellers operate — your actual per-unit exposure is materially higher than the advertised average.
The sellers feeling the most acute pressure in 2026 are those in three specific situations: thin-margin SKUs (already operating at 8–12% net margin with no buffer), heavy or oversized products (where dimensional weight fees compound more aggressively), and sellers with uneven inventory coverage (who routinely trigger both the low-inventory fee and the aged-inventory surcharge in alternating cycles). If your catalog hits any of these profiles, the fee layering effect is not a theoretical concern — it’s an active drain on your P&L right now.
The Cumulative Cost of Amazon Access
Stepping back from individual fee changes, the broader picture is this: in 2026, Amazon fees alone — referral, fulfillment, storage, placement, surcharges — commonly consume 34–50% of gross revenue for FBA sellers. Add COGS, advertising spend (ACoS averaging around 30% for competitive categories), and overhead, and the true net margin for a typical healthy FBA business sits at 15–25% of revenue. Top-quartile operators achieve 25–30%. Below-median operators are working with single-digit net margins where a fee reset of this magnitude can push them into negative contribution on individual SKUs.
Diagnosing Your Profit Stack: The SKU-Level Audit You Should Have Run Yesterday
The first and most important step in rebuilding your profit stack is developing a clear, accurate view of where the money is actually going — at the individual SKU level, not at the account or category level. Most sellers are managing their business on blended metrics: overall revenue, overall ACoS, blended net margin. These numbers hide the fee bleeders that are quietly destroying profitability across your catalog.
Building Your SKU-Level P&L
A complete 2026 SKU-level P&L needs to include every variable cost component. For each ASIN, you need to model:
- Sale price (use your average selling price, not the list price)
- Referral fee (category percentage × average selling price)
- FBA fulfillment fee (including the 2026 base rate + 3.5% fuel surcharge)
- Inbound placement fee (per unit, based on your current inbound strategy and size tier)
- Monthly storage cost allocation (per unit, based on cubic footage × average days in storage)
- Aged inventory surcharge exposure (probability-weighted based on your sell-through rate)
- True COGS (product cost + inbound freight + prep fees + any packaging material changes)
- PPC cost per unit sold (total ad spend ÷ total units sold for that ASIN)
- Return rate cost (return rate × average return processing cost)
The resulting number — Sale Price minus all of the above — is your true profit per unit. Do this calculation for every SKU in your catalog and sort the results. What you’ll typically find falls into three buckets.
The Three Buckets Every Audit Reveals
Profit Anchors (typically 20–30% of SKUs, 60–80% of profit): These are the products where your true per-unit margin is healthy, the fee structure is manageable, and the product has good velocity. These deserve more attention, not less. Protect them, optimize them, and consider whether you can create variants or line extensions.
Fee Bleeders (typically 30–40% of SKUs, marginally profitable or break-even): These products are making money on paper but losing it in reality once full fee stacking is applied. They’re worth salvaging — but only after you’ve identified which levers are in play. Often, a packaging change, a price adjustment, or an inbound strategy modification can turn a fee bleeder back into a contributor.
Zombie SKUs (typically 10–20% of SKUs, net negative contribution): These products are destroying value. Every unit sold either loses money outright or fails to cover the overhead and capital cost of holding the inventory. They need an exit plan — whether that’s removal, liquidation, or a full price increase that either restores margin or naturally phases the SKU out of your catalog.
The Diagnostic Metrics That Matter Most in 2026
Beyond per-unit profit, three ratios deserve ongoing tracking in the current fee environment. Your Fee-to-Revenue Ratio (total Amazon fees ÷ gross revenue) should be benchmarked at below 40% for a healthy account — if it’s running above that, you have structural fee exposure that margin improvements alone won’t fix. Your Inventory Sell-Through Rate needs to stay high enough to avoid crossing the 181-day aged inventory threshold — track it by ASIN weekly, not monthly. And your Average Order Value (AOV) is a proxy for fee dilution efficiency — higher AOV means fixed FBA costs represent a smaller percentage of each sale.
Packaging as a Profit Engine — The Dimensional Weight Opportunity
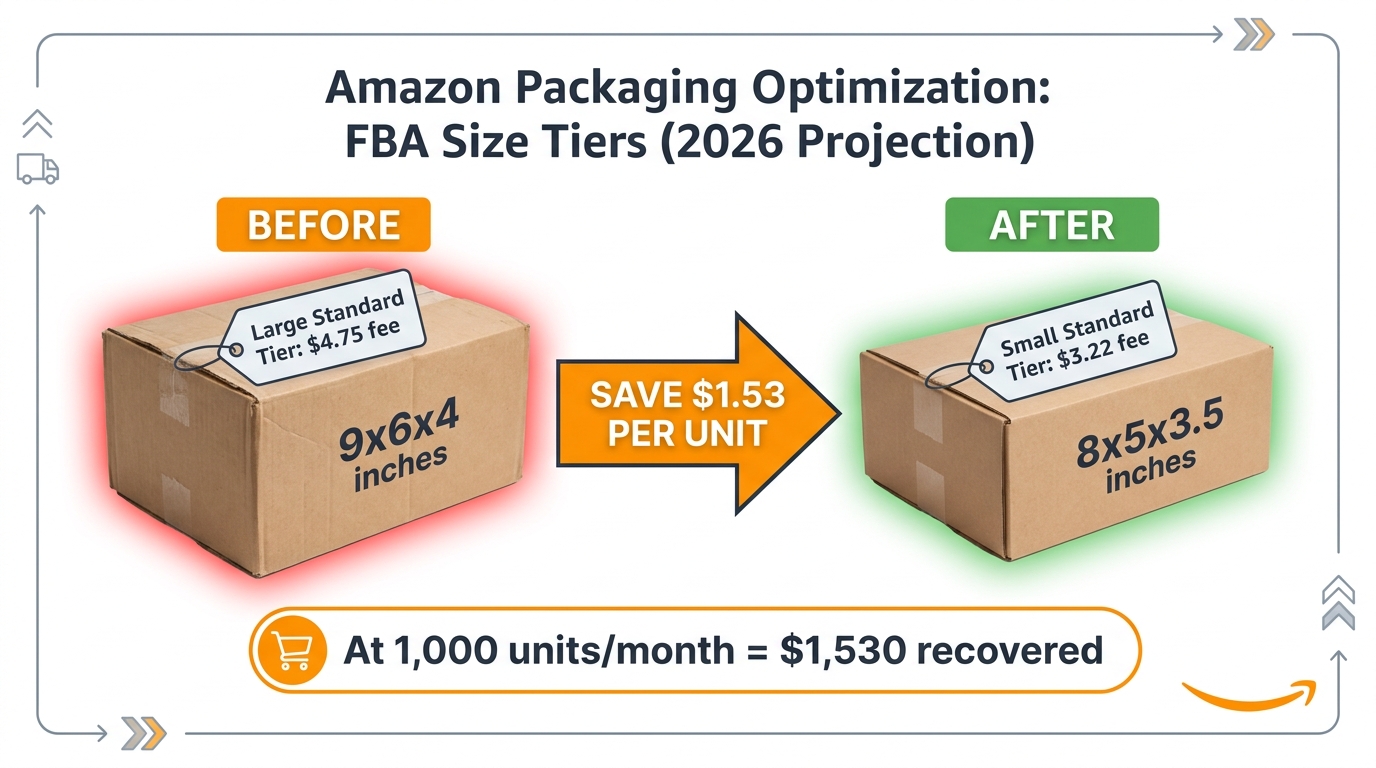
If there’s one area of the 2026 fee environment where sellers have genuine, near-term control over outcomes, it’s packaging. Amazon’s FBA fee calculation is based on the greater of unit weight or dimensional weight, and it assigns each product to a size tier based on the longest side, median side, and shortest side of the packaged product. Crossing a size tier boundary — even by a fraction of an inch — can add anywhere from $0.30 to $2.00+ to your fulfillment fee per unit.
How Dimensional Weight Fee Traps Work
Dimensional weight is calculated by multiplying length × width × height (in inches) and dividing by a dimensional divisor (Amazon uses 139 for standard-size products). If this calculated weight exceeds the actual unit weight, Amazon charges the higher dimensional weight. This creates a specific trap: products with light physical weight but moderate physical size — think foam items, lightweight accessories, multi-piece kits with air space — often pay fulfillment fees based on their dimensional weight rather than their actual mass.
The fix is measurable and executable. A seller who can reduce a product’s packaging dimensions from 9″ × 6″ × 4″ to 8″ × 5″ × 3.5″ — a seemingly minor change — drops from one size tier to the next, reducing the fulfillment fee by $0.50–$1.50 per unit depending on the tier. At 1,000 units per month, that’s $6,000–$18,000 in annual savings from packaging engineering alone.
The Packaging Audit Process
Run a packaging audit on your top 20 SKUs by volume. For each one, compare the current packaged dimensions against Amazon’s published size tier thresholds. Then ask: how close are you to the boundary of the next tier down? If you’re within 0.5–1.5 inches of a tier boundary, that product deserves an immediate packaging redesign evaluation.
The process typically involves working with your manufacturer or a packaging specialist to redesign the outer carton, reduce void fill, reconfigure product orientation inside the package, or shift from retail-style packaging to minimal poly-bag or slim-box configurations. Many sellers resist this because they’ve invested in branded packaging — but the math often tells a different story. A $1.20 per unit fee reduction from packaging optimization offsets the cost of redesigning packaging after fewer than 2,000 units.
Material and Weight Optimization
Weight reduction is the other side of the packaging equation. Every gram counts when Amazon is billing on the higher of actual versus dimensional weight. Switching from standard cardboard inserts to lighter molded pulp, reducing protective foam thickness where product damage rates allow, or eliminating dual-layer packaging are all viable paths to weight reduction. Even dropping a product from a weight billing boundary (say, from 1.1 lbs to 0.9 lbs) can shift the fee tier and deliver per-unit savings that compound across the year.
The key discipline here is to measure before and after, and to calculate the per-unit savings against the cost of packaging changes. Not every optimization will deliver a positive ROI — but in the 2026 fee environment, the ones that do are among the highest-return investments available to an Amazon seller.
Inbound Strategy Overhaul — Beating the Placement Fee at Its Own Game
Inbound placement fees represent one of the most controllable — and most mismanaged — cost categories in the 2026 fee structure. The range from $0.21 to $1.58 per unit is not random; it’s directly tied to the choices you make about how and where you ship your inventory. Understanding the mechanics gives you real leverage.
The Three Inbound Strategies and Their True Costs
Amazon offers sellers three primary inbound approaches, each with different cost and complexity profiles. Minimal shipment splits — sending all inventory to one or two FCs — is the simplest approach operationally but incurs the highest placement fees, since Amazon must redistribute the inventory across its network at your expense. Partial split programs — using Amazon’s Partnered Carrier or approved carrier programs with pre-distributed shipment plans — reduce placement fees to a mid-range rate and moderate the freight complexity. Full distributed shipping — sending your own shipments to all assigned FCs in the quantities Amazon specifies — eliminates or minimizes placement fees entirely, but requires multiple shipments, higher freight logistics, and usually a 3PL partner to execute efficiently.
The right strategy depends entirely on your product economics. For a high-velocity SKU moving 3,000+ units per month, full distributed shipping with a 3PL partner typically pays for itself in fee savings within one to two months. For a slow-moving SKU at 200 units per month, the freight complexity of splitting shipments may cost more than the placement fee savings. The math is different for every product, which is why this analysis belongs at the SKU level.
3PL Partnership as a Fee Engineering Tool
The rise of third-party logistics partners who specialize in Amazon inbound prep and distributed shipment management has become strategically relevant in 2026 in a way it wasn’t three years ago. A well-integrated 3PL relationship lets you receive full container loads at one facility, have them sorted, prepped, and labelled per Amazon’s specifications, and then distributed to multiple FCs according to the quantities Amazon’s inbound plan requires — at a cost that often runs $0.10–$0.40 per unit in handling fees, well below the $0.50–$1.58 placement fees it offsets.
When evaluating 3PL partnerships for this purpose, the key metrics are: per-unit handling cost, turnaround time from receipt to shipment out, error rate on labeling and prep, and whether they have pre-existing Amazon-approved configurations. Speed matters here — inventory sitting in a 3PL facility for 10+ days before shipping to FCs is inventory that isn’t selling and is incurring storage costs at the 3PL instead of Amazon.
Shipment Planning as a Weekly Practice
One operational change that consistently improves inbound fee economics is moving from periodic large shipments to more frequent, smaller, better-distributed shipments. Sellers who batch their FBA replenishment into monthly or quarterly large sends often end up with both high placement fees (because they’re sending large volumes to limited FCs) and elevated storage costs (because large sends create inventory spikes that take weeks to deplete, extending average days in storage). Shifting to weekly or bi-weekly smaller replenishment cycles typically reduces both exposure categories simultaneously — at the cost of higher per-shipment freight rates, which need to be modeled against the fee and storage savings.
Inventory Velocity and the Aged Inventory Surcharge Trap
The aged inventory surcharge is, in many ways, the most punishing fee structure in Amazon’s 2026 cost architecture — not because it’s the largest fee, but because of how silently and rapidly it compounds. The 2026 change that moved the surcharge trigger from 271 days to 181 days effectively shortened the window between “fine” and “expensive” by nearly three months. For sellers with seasonal products, long supply chains, or products experiencing velocity declines, this is a material structural change.
The Cost Cliff at 181 Days
Here is the progression sellers need to internalize: monthly storage fees for standard-size items run approximately $0.87 per cubic foot from January through September, and higher in Q4. That’s the baseline. Once inventory crosses the 181-day threshold, the aged inventory surcharge kicks in — at a rate that can add $3.63 per cubic foot or more depending on the specific tier and duration. For items crossing 271 days and beyond, the rates escalate further and Amazon may begin charging higher daily rates that compound your cost exposure in a non-linear way.
The critical planning number is your days-in-stock rate per SKU. Take your current FBA inventory level for an ASIN, divide it by your average daily sales rate, and you get an estimated days-of-supply number. If any SKU is sitting above 120 days of supply, it’s at risk of crossing the 181-day surcharge threshold on existing units before you deplete them. That’s a signal for immediate action.
The IPI Score Connection
Your Inventory Performance Index (IPI) score — Amazon’s composite measure of inventory health — is directly impacted by aged inventory levels. Sellers with IPI scores below Amazon’s threshold face storage space restrictions, which creates a vicious cycle: restricted storage space forces you to send less inventory, which increases the risk of stockouts, which triggers the low-inventory-level fee. Managing the aged inventory surcharge isn’t just about avoiding a fee — it’s about preserving the operational flexibility that healthy IPI scores provide.
The Liquidation vs. Removal Decision Framework
When inventory is approaching or has crossed the 181-day threshold, sellers face a three-way decision: continue paying surcharges in hopes of selling through, liquidate via Amazon’s liquidation program, or remove inventory to a 3PL or back to your facility. The math for each path is straightforward but often emotionally difficult — particularly for sellers who’ve invested in custom packaging or branded products.
Amazon’s liquidation program typically returns 5–10% of the item’s average selling price. That sounds terrible until you compare it against the ongoing cost of holding inventory past 181 days at escalating surcharge rates. For a product that’s been sitting for 200 days with a $20 selling price and $3.63/cubic foot surcharge costs, the liquidation return — even at 7% — often exceeds the net present value of continuing to pay storage and hope for organic sell-through. Model it numerically before deciding based on emotion.
Proactive Inventory Velocity Tools
Three tactics consistently improve inventory velocity without sacrificing margin: lightning deal nominations for slow-moving ASINs (using Amazon’s promotional tools to create a velocity spike before approaching surcharge thresholds), price reduction testing (a 10–15% temporary price reduction on high-age inventory can dramatically accelerate sell-through, and the cost of the discount often runs less than continued storage fees), and sponsored ad intensification on aging inventory (increasing PPC spend on units approaching 150 days to spike short-term velocity, then scaling back once inventory is within a safe days-of-supply range).
Pricing Power — How to Pass Through Fees Without Losing Rank
Perhaps the most misunderstood margin lever in the 2026 environment is price. Most sellers treat their price as a fixed variable — set at launch, adjusted occasionally, but not used as a primary profit engineering tool. In a fee environment where costs are rising across every line item, price is one of the few levers that directly improves margin without requiring operational changes.
What the Data Says About Elasticity
Recent analyses of Amazon seller behavior and demand data in 2026 suggest that moderate price increases of 2–4% typically result in smaller-than-expected demand reductions — and often improve total profit even when unit volume falls slightly. Amazon shoppers exhibit relatively lower price sensitivity compared to direct-to-consumer channels for two reasons: the trust and convenience premium they assign to Prime-eligible products, and the comparative nature of Amazon search, where most shoppers are comparing multiple options rather than fixating on absolute price.
This doesn’t mean blanket price increases are risk-free. Category matters enormously. Commoditized products with many comparable alternatives — household staples, generic accessories, low-differentiation consumables — face much higher elasticity than differentiated products where your brand, reviews, and imagery provide meaningful purchase justification. Before raising prices, you need to understand your competitive set and your differentiation.
The Real Floor Price Formula
Every seller should have a real floor price for each ASIN — the minimum price at which the product achieves a target net margin, accounting for all costs in the 2026 fee structure. The formula is:
Floor Price = (True COGS + FBA Fee + Surcharges + Inbound Placement + Storage Allocation + Target Profit) ÷ (1 − Referral Fee %)
This floor price calculation should be run with the 2026 fee structure fully incorporated — including the 3.5% fuel surcharge on the FBA fee and the current inbound placement fee for your shipping strategy. Many sellers discover when they run this calculation that their current prices are below their 2026 floor price — meaning they’re already selling at a structural loss. Correcting this is not optional. It’s foundational.
Incremental Testing Protocol
For products where you have pricing power, test increases incrementally. A proven approach: increase price by 3–5% and monitor for 14–21 days, tracking unit velocity, BSR trend, conversion rate (available through Seller Central’s Business Reports), and total contribution margin. If conversion drops by less than the percentage increase in price, the test is profitable — your revenue per sale went up by more than your volume went down. If conversion drops more than the price increase percentage, hold the line or partially revert.
One important nuance in 2026: Amazon’s A10 algorithm incorporates price competitiveness signals in its ranking logic. Aggressive price increases that move you significantly above the category median can impact organic ranking and Buy Box win rate — particularly in competitive categories where multiple sellers offer comparable products. Price tests should be paired with close monitoring of organic ranking position and Buy Box ownership percentage, not just sales volume.
Bundling and AOV Engineering to Dilute Fixed Fee Costs
The elegance of bundling as a margin recovery strategy is that it attacks the fee problem from a structural angle rather than a rate angle. You’re not trying to pay fewer fees — you’re engineering the ratio of fees to revenue to be more favorable by increasing the value captured per FBA transaction.
The Fee Dilution Math
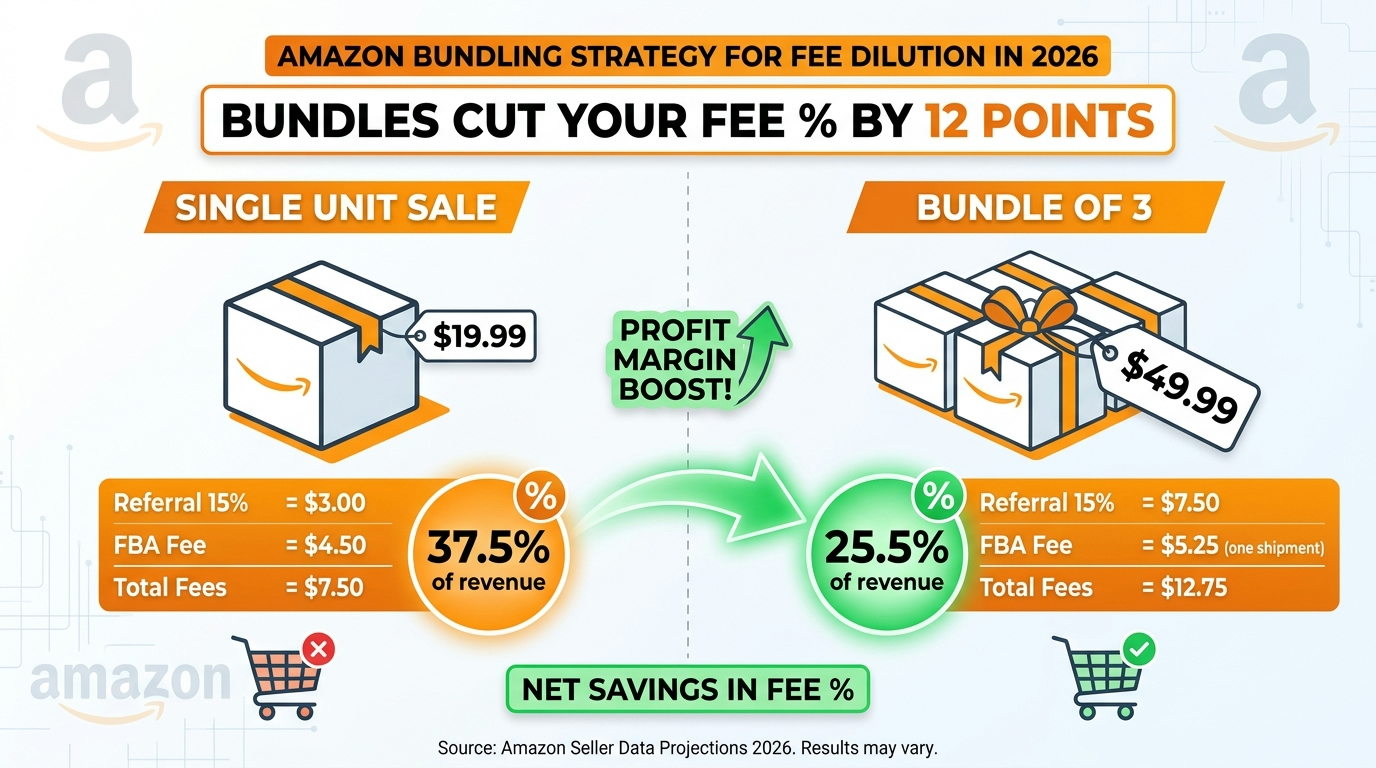
Here’s why bundling works: most FBA fees scale with physical product characteristics (size, weight) rather than proportionally with price. A bundle of three complementary items might have a total sale price of $49.99 but an FBA fulfillment fee of only $5.25 — because the three items, packed together efficiently, don’t triple in cubic footage. Compare this to selling three individual units at $16.99 each: you pay three separate referral fees, three separate FBA fees, three inbound placement fees, and three storage cost allocations. The bundle captures essentially the same gross revenue but dramatically reduces the fee-to-revenue ratio.
As a rough illustration: on a $19.99 single-unit sale with 15% referral fee and $4.50 FBA fee, Amazon fees represent approximately 37.5% of revenue. On a three-unit bundle at $49.99 with the same 15% referral fee and a $5.25 FBA fee (one shipment, moderate size increase), Amazon fees represent approximately 25.5% of revenue. That 12-percentage-point improvement in fee ratio translates directly to net margin.
Identifying Bundle Candidates in Your Catalog
Not every product bundles well. The most compelling bundle candidates share these characteristics: they’re naturally purchased together (complementary use cases), they’re small enough that bundling doesn’t create an oversized FBA product, they have similar or complementary customer demographics, and at least one component is a strong seller with good reviews that can carry the bundle’s visibility.
Common high-performing bundle structures in the current Amazon environment include consumable multi-packs (same product, multiple units — often the lowest-friction bundle to create and list), complementary accessory bundles (main product + 1–2 accessories with strong usage affinity), and value-add kit bundles (product + instructional guide or digital component, increasing perceived value without significant cost increase).
Virtual Bundles vs. Physical Bundles
Amazon offers two bundling mechanisms with very different fee implications. Physical bundles — pre-packaged multi-unit products that are created before shipment to FBA — receive a single combined FBA fee based on the bundled unit’s size and weight. This typically delivers the best fee dilution but requires manufacturing or packaging changes upstream. Virtual bundles — created through Amazon’s Virtual Product Bundles tool for brand-registered sellers — pair existing standalone ASINs together on a single product page without physical combination. Virtual bundles retain the individual FBA fees for each component (they’re still picked and shipped separately), so the fee dilution is less dramatic — but they’re faster to test and can identify high-performing bundle combinations before you commit to physical packaging changes.
When to Cut, Kill, or Migrate a SKU
One of the most valuable — and most underused — decisions available to Amazon sellers in 2026 is the deliberate reduction of catalog size. The fee environment is unforgiving to underperforming SKUs: they incur storage fees regardless of velocity, they pull sales rep time and PPC budget, and they clutter your IPI calculation. A disciplined approach to SKU rationalization is often worth more per month than any individual fee optimization tactic.
The SKU Decision Matrix
Use the output of your SKU-level audit to categorize every ASIN into one of four quadrants based on two dimensions: true net margin (positive or negative, above or below your target threshold) and revenue significance (does this SKU contribute meaningfully to your total revenue?)
High margin + high revenue: Protect these. Invest in them. Optimize packaging, inbound, and PPC to extend their leadership. These are your catalog’s core assets.
High margin + low revenue: Grow or hold. These are candidates for PPC investment to increase visibility, bundle inclusions to increase attach rate, or variation additions to expand their reach. They’re profitable at current scale — the question is whether they can scale.
Low margin + high revenue: Fix or migrate. These are the most dangerous SKUs in your catalog — high revenue gives the illusion of health while thin margins mean even small fee changes wipe out contribution. Prioritize these for packaging optimization, price testing, and inbound strategy overhaul. If none of those levers recover margin to target, evaluate whether the product can be shifted to FBM for some volume (removing FBA fees for certain orders) or exited over a planned 60–90 day runway.
Low margin + low revenue: Exit. These products are destroying capital and bandwidth without meaningful contribution. Create a removal or liquidation plan and execute it within 30 days before aged inventory surcharges compound further.
FBM as a Margin Recovery Channel
Fulfilled by Merchant (FBM) has historically been treated as a less desirable option — slower delivery, no Prime badge, lower conversion. But in 2026, FBM has become a strategically useful partial alternative for specific SKU types. Products that are heavy, oversized, or have high FBA fee-to-ASP ratios can sometimes achieve better net margins through FBM, particularly for non-Prime orders and off-Amazon channels. Maintaining an FBM listing alongside an FBA listing — with FBM activated only when FBA inventory runs out or when you’re liquidating aging FBA stock — is a flexibility strategy more sellers should be using.
Migrating Products Across Channels
For brands with their own website, Shopify store, or other retail presence, the 2026 fee reset has prompted a broader conversation about channel mix. Amazon remains the dominant e-commerce channel and offers unmatched traffic and trust — but the economics of serving every product through FBA are no longer automatically favorable. A product that earns a 10% net margin on Amazon might earn 35%+ direct-to-consumer, even accounting for higher customer acquisition costs. Slowly migrating a portion of your lowest-margin SKUs toward DTC while maintaining a streamlined, high-margin Amazon catalog is a defensible strategic move for the next two to three years.
The 90-Day Profit Stack Rebuild Roadmap
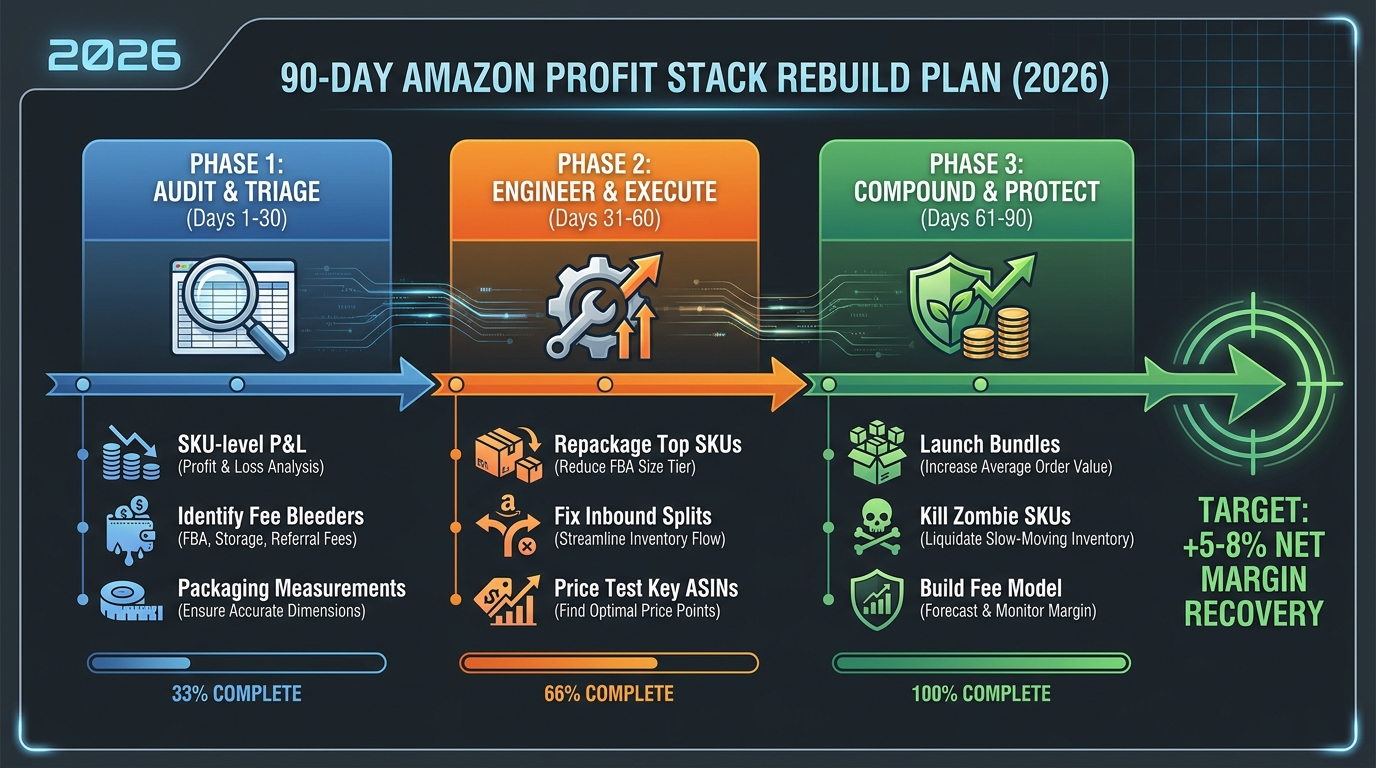
Every tactic discussed in this article works. None of them work instantly. The sellers who will meaningfully recover margin by the end of 2026 are those who execute systematically over a defined timeframe — not those who implement one change and wait to see what happens. Here is a 90-day structured roadmap for rebuilding your profit stack.
Days 1–30: Audit and Triage
This phase is entirely about diagnosis. No major changes yet — just measurement and prioritization. The goal is to know exactly where you stand before you move.
Week 1: Export your full catalog from Seller Central. Pull the FBA revenue and fee reports for the last 90 days. For every ASIN generating more than $500 per month in revenue, calculate the full true per-unit profit using the formula outlined earlier. Include the 2026 fee structure — the base FBA increase, the 3.5% fuel surcharge, and your actual inbound placement fee rate.
Week 2: Run the packaging audit. Physically measure (or pull from Seller Central’s product specifications) the packaged dimensions of your top 30 SKUs by volume. Compare each against the Amazon size tier chart. Identify which SKUs are within 1.5 inches of a size tier boundary in any dimension. Flag these as packaging optimization candidates.
Week 3: Run the inventory age analysis. Pull your FBA Inventory Age report from Seller Central. Identify every ASIN with units that have been in FBA more than 120 days. Calculate the days-of-supply remaining at current velocity. Flag every ASIN where existing units are likely to cross the 181-day threshold before being sold.
Week 4: Categorize every ASIN into the four-quadrant SKU matrix. Build your prioritized action list: top 5 packaging candidates, top 5 aging inventory alerts, top 5 SKUs for price testing, and your exit list for zombie SKUs.
Days 31–60: Engineer and Execute
This phase is implementation. You’re executing the highest-ROI changes identified in the audit phase.
Packaging redesigns: Brief your manufacturer or packaging supplier on the top 5 packaging candidates. For SKUs with enough velocity, expedite sample production of redesigned packaging. Run a small test batch through FBA to confirm the new size tier classification before committing to a full production run change.
Inbound strategy shifts: Evaluate whether a 3PL partnership for distributed FBA shipping makes economic sense for your top-volume SKUs. Get quotes from two to three Amazon-specialized 3PL providers for per-unit prep and distributed shipping costs. Compare against your current inbound placement fee exposure. If the math supports it, pilot the shift with one or two SKUs before scaling.
Price testing: Begin price tests on the five highest-potential SKUs identified in the audit. Increase price by 4–6%, monitor for 14 days, and record the impact on units sold, revenue, and BSR. Use this data to build your elasticity curve for each product before making permanent price changes.
Aging inventory interventions: For every ASIN flagged as approaching the 181-day surcharge threshold, implement one of the three velocity tools: a lightning deal nomination, a temporary 10–15% price reduction, or a PPC spend intensification campaign. Begin removal orders for confirmed zombie SKUs.
Days 61–90: Compound and Protect
This phase is about building structural protection — making the profit stack resilient to future fee changes, not just recovering from 2026’s.
Bundle launch: Using the virtual bundle tool as a testing mechanism, launch two to three bundle combinations with your highest-velocity complementary products. Track bundle conversion rate and margin for 30 days. Promote the strongest performer with targeted PPC. Plan physical bundle production for Q4 based on what the virtual bundle data reveals.
Pricing floor documentation: Embed the 2026 floor price formula into your catalog management spreadsheet or software. Set automated repricing rules that prevent any ASIN from dropping below its calculated floor price, accounting for all fee stacking. This is the single most durable protection against margin erosion through repricing wars.
Inbound cadence optimization: Shift to a more frequent, smaller-volume inbound replenishment schedule for your top 10 SKUs. Monitor the impact on average days-in-storage and placement fee exposure over 30 days. Calibrate the replenishment frequency against freight cost increases to find the optimal cycle for each product.
Fee monitoring system: Build or subscribe to a tool that tracks your actual per-unit fee costs against your modeled costs monthly. Amazon periodically adjusts fee rates, storage rates, and surcharge structures — the sellers who maintain margin visibility are those who catch changes quickly and respond within weeks, not quarters. Set a monthly fee reconciliation review as a standing business calendar item.
Building a Fee-Proof Business Model for the Long Game
There is no version of Amazon selling in 2026 where the fee environment gets simpler. The structural direction of Amazon’s cost architecture — more granular fee categories, more behavioral penalty charges, more surcharge mechanisms — has been consistent for five years and shows no sign of reversing. The sellers who will be profitable in 2027 and beyond are not those who optimize reactively to each annual fee update. They’re those who build a business model that is structurally resilient to fee escalation.
What Fee-Proof Actually Looks Like
A fee-proof Amazon business has several identifiable characteristics. It operates with a catalog of genuinely differentiated products — products where your brand, imagery, reviews, and customer experience justify a price premium that absorbs fee increases without requiring equivalent price increases in the consumer market. It maintains packaging that is permanently optimized to the smallest economically viable size tier, reviewed every time a new product is launched or a fee tier boundary shifts. It has inventory systems that prevent aging — automated reorder points, sell-through monitoring, and pre-planned promotional mechanisms that fire before units approach the 181-day threshold.
It also has a clear channel mix strategy — knowing which products belong on Amazon and which belong in other channels based on fee-adjusted margin, not just raw revenue. And it has a floor price culture — every person who touches pricing in the business knows the real cost of goods including all Amazon fees, and knows that the floor price is not negotiable regardless of competitive pressure.
The Mindset Shift That Changes Everything
The sellers who consistently outperform in Amazon’s fee environment share one common trait: they treat Amazon as a fee structure to be managed, not a marketplace to be operated on. Every SKU launch decision includes a full fee model. Every packaging choice is evaluated against dimensional weight implications. Every inventory replenishment decision includes an aging analysis. Every price change is evaluated against the floor price formula.
This is not a complex system. It’s a disciplined one. The profit stack you rebuild over the next 90 days won’t be built from one dramatic change — it will be built from 15–20 small, compounding improvements that collectively recover 5–8 percentage points of net margin. In a business generating $500,000 in annual Amazon revenue, that recovery is worth $25,000–$40,000 per year. That’s the real math of the 2026 fee reset — and it’s entirely within your control to capture it.
Key Takeaways
- The “$0.08 per unit” headline is misleading. After layering the 3.5% fuel surcharge, inbound placement fees, aged inventory surcharges, and low-inventory penalties, many sellers face $0.30–$1.50+ in true per-unit cost increases.
- Amazon fees now consume 34–50% of gross revenue for typical FBA sellers. True net margin is typically 15–25% — leaving little buffer for unmanaged fee escalation.
- Packaging optimization is the fastest high-ROI lever. A single size-tier drop can save $0.50–$2.00 per unit and recover thousands per month with no change to the product itself.
- The aged inventory clock now starts at 181 days, not 271. Any ASIN above 120 days of supply needs an immediate velocity intervention plan.
- Bundling structurally improves your fee-to-revenue ratio by capturing more revenue per FBA transaction without proportional fee increases.
- Build a real floor price for every ASIN that incorporates the full 2026 fee stack. Set it as a hard lower bound on your repricing rules.
- Run the 90-day rebuild roadmap with phases: Audit first, then execute the highest-ROI changes, then build structural protections that compound over time.