


Ask ten Amazon sellers how profitable their catalog is and nine of them will quote you a number derived from a spreadsheet that was built three fee cycles ago. The referral fee is in there. The FBA fulfillment fee, probably. Maybe a rough estimate for advertising. And then — profit.
That model is no longer usable.
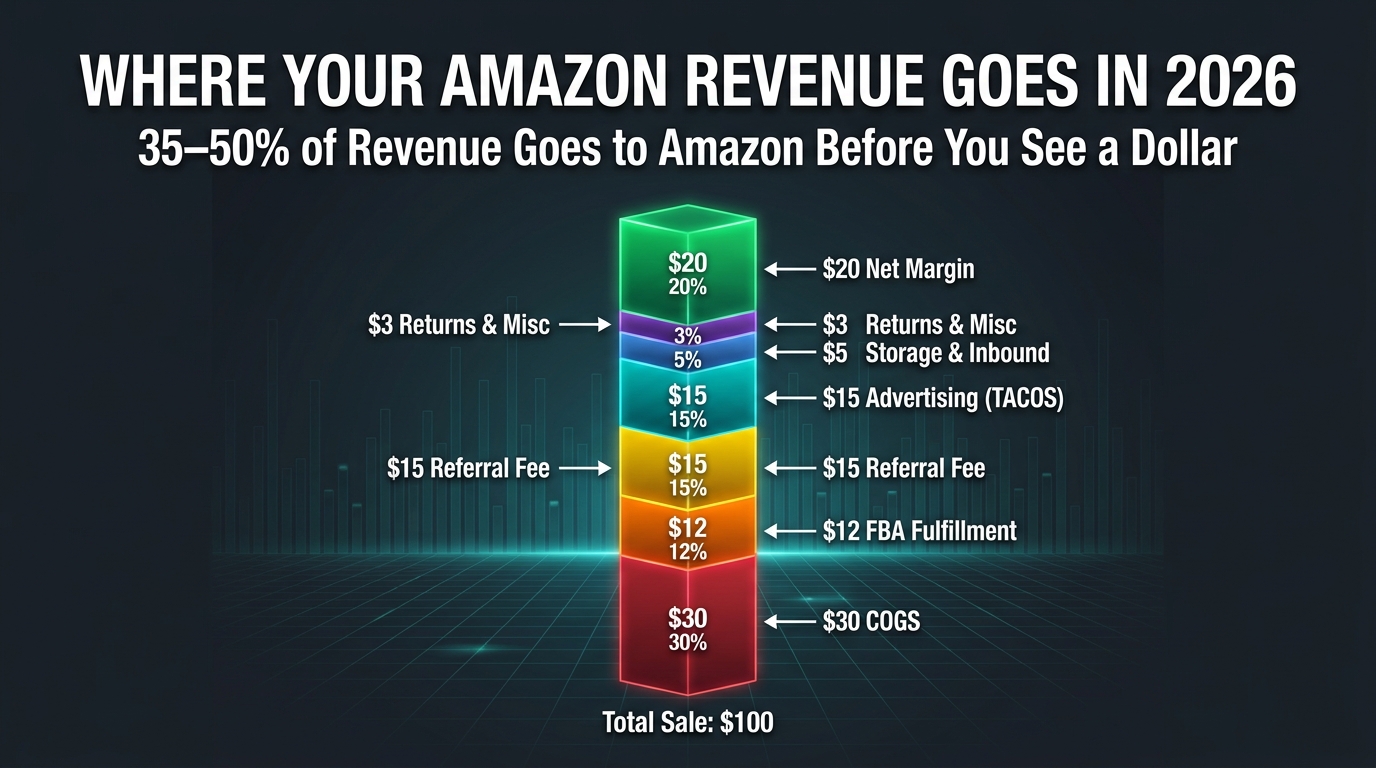
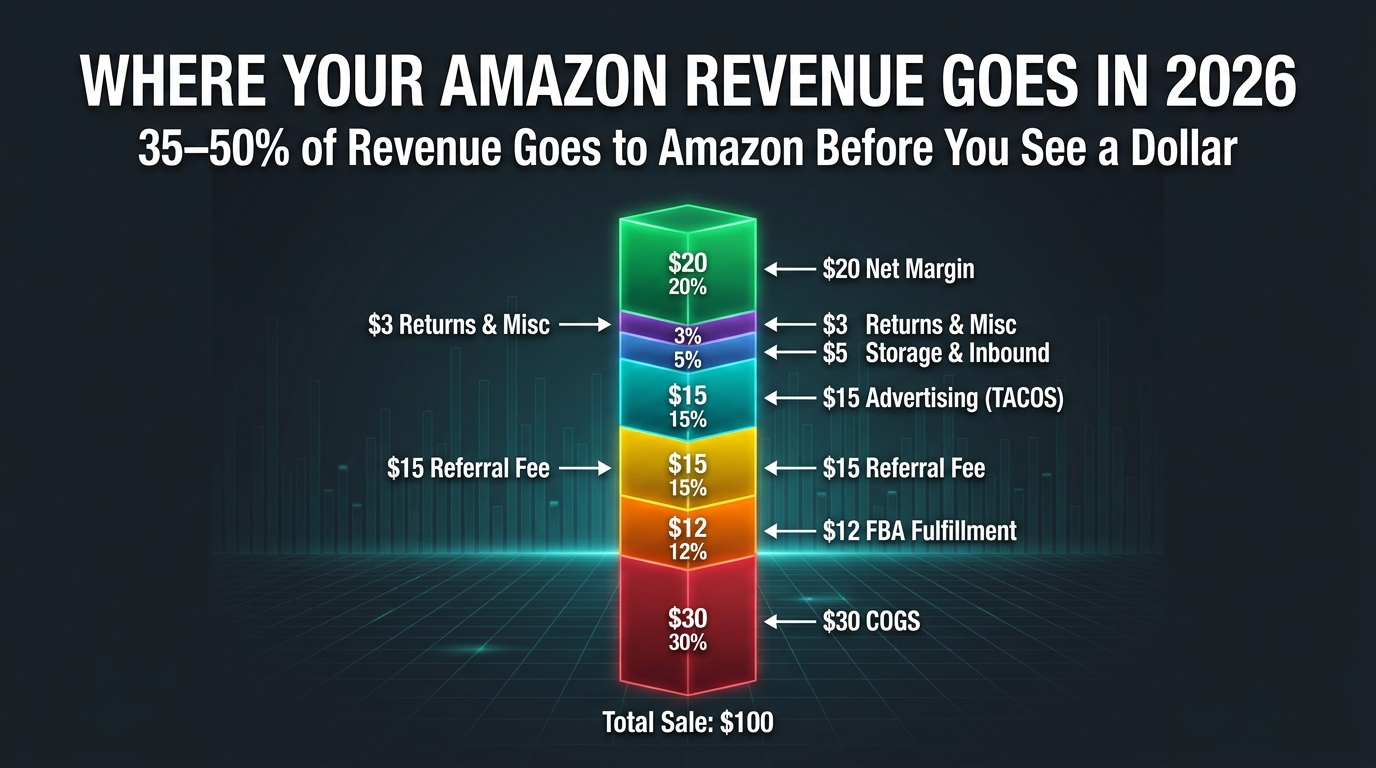
Between January and April 2026, Amazon added or restructured at least five distinct cost layers that don’t appear in most seller P&Ls: an updated inbound placement fee schedule, a tighter low-inventory-level (LIL) fee now calculated at the FNSKU level, a 3.5% fuel and logistics surcharge applied to all FBA fulfillment fees from April 17, revised storage utilization dynamics, and a new DD+7 payout policy that lengthens the cash conversion cycle. Stack those on top of referral fees (still 8–17% depending on category), monthly storage charges, aged inventory surcharges, returns processing fees, and advertising — and the total Amazon “take rate” for a typical FBA seller now runs between 35% and 50% of gross revenue before you’ve paid for the product itself.
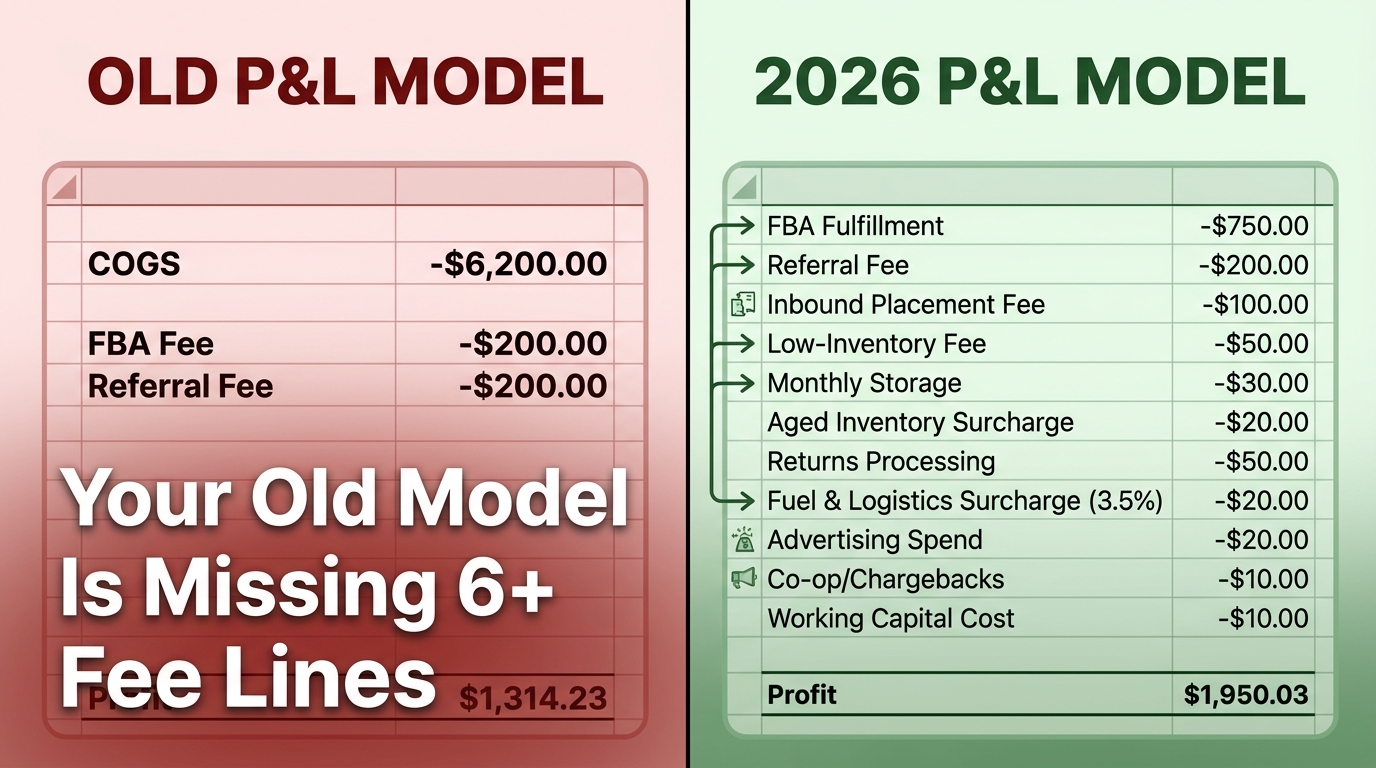
The problem isn’t the individual fees. Most of them, in isolation, are small. The problem is that sellers are making pricing, sourcing, and catalog decisions based on P&L models that are structurally incomplete. A SKU that looks like it earns a 28% margin in a four-line spreadsheet may actually be running at 9% — or losing money — once every Amazon cost is properly allocated.
This article is a practical guide to rebuilding that model from scratch. Not as a theoretical exercise, but as a working decision-making tool: which SKUs to keep, which to cut, how to price for actual profitability, and how to stress-test your catalog against fee changes before they hit your bank account.
Why Most Amazon P&L Models Are Already Broken
The P&L model most Amazon sellers are using today was probably built to pass a gut-check: “does this product make money?” For early-stage sellers evaluating a potential product, a four-to-six-line model is adequate. For anyone managing an active catalog at any meaningful scale, it has quietly become a liability.
The Fee Proliferation Problem
Amazon has introduced more new fee categories between 2023 and 2026 than in the preceding five years combined. In 2023, the inbound placement fee arrived. In 2024, the low-inventory-level fee was formalized. In early 2026, both were recalibrated upward. In April 2026, the fuel and logistics surcharge appeared with no sunset date. Each fee, announced separately and applied incrementally, is easy to absorb mentally as a minor adjustment. Together, they represent a structural shift in the cost architecture of selling on FBA.
The typical pre-2023 Amazon P&L had roughly five to six line items: selling price, referral fee, FBA fulfillment fee, COGS, advertising, and a rough storage estimate. A fully loaded 2026 model has between twelve and fifteen distinct cost lines — and every one of them can vary by SKU depending on product dimensions, weight, category, inventory velocity, return rate, and shipment configuration.
The Blended Average Trap
Even sellers who know their fees are understated often fall into the blended average trap: they calculate total Amazon fees as a percentage of total revenue across the whole account, then apply that percentage to individual SKUs. This approach completely masks the variance within a catalog. A high-velocity, lightweight consumable and a slow-moving, heavy-and-bulky item will have dramatically different fee profiles — but if you model them with the same blended percentage, you’ll systematically overstate the profitability of the heavy item and understate the edge of the fast mover.
The consequence is misallocated capital: advertising budget going to low-margin SKUs that feel profitable on paper, inventory being over-ordered for products that will generate aged inventory surcharges before they sell, and pricing decisions made on incomplete unit economics. The margin erosion from poor modeling is not dramatic in any single week. It compounds quietly over quarters.
What a Complete Model Actually Requires
A functional 2026 P&L model needs to capture fees at the per-unit level, per-SKU, with actual (not estimated) rates for each cost category. That means pulling data from multiple Seller Central reports — the Fee Preview report, the FBA Fee report, the Inventory Health report, and the Advertising console — and joining them at the ASIN or FNSKU level. It’s a more complex data operation than most sellers have set up. But the operational payoff — knowing with confidence which products are actually worth selling, at what price, with what ad spend — is now the single largest source of competitive advantage available to an Amazon seller that doesn’t require any new product launches.
The Full 2026 Amazon Fee Inventory: Every Cost Line You Need to Track
Before you can rebuild your P&L, you need a complete inventory of what Amazon actually charges. Here is the current full list of fee types that should appear as distinct line items in any serious seller model.
Referral Fees
Referral fees remain the most predictable line item: a flat percentage of the selling price, deducted on every sale. Rates range from 8% to 20% depending on category, with most standard consumer goods categories sitting at 15%. Notable exceptions: Baby Products and Beauty/Health products are 8% on items under $10–$15 and 15% above that; Computers and Consumer Electronics are 8%; Automotive and Powersports is 12%; Jewelry and Fine Art run at tiered rates that top out at 20%. Clothing and Accessories stays at 17%. In the U.S., 2026 brought no material referral fee changes beyond what was introduced for low-price apparel in 2024. EU sellers received more meaningful relief, with referral fee reductions in clothing and several consumer categories, but that’s a separate analysis.
FBA Fulfillment Fees
The core per-unit fulfillment fee, covering pick, pack, and ship from the Amazon FC. In 2026, standard-size non-apparel items saw modest increases in the $0.20–$0.30 range for most size tiers, with the overall average across the catalog running approximately $0.08/unit higher than 2025. The fee depends on unit weight and dimensions — small standard items start around $3.86 per unit; larger standard items run $4.50–$6.00+; oversized and bulky items can reach $9–$20+ per unit. The Low-Price FBA program (for items under $10) has a discount that increased in 2026 to $0.86 off the standard rate, up from $0.77.
Fuel and Logistics Surcharge (April 2026)
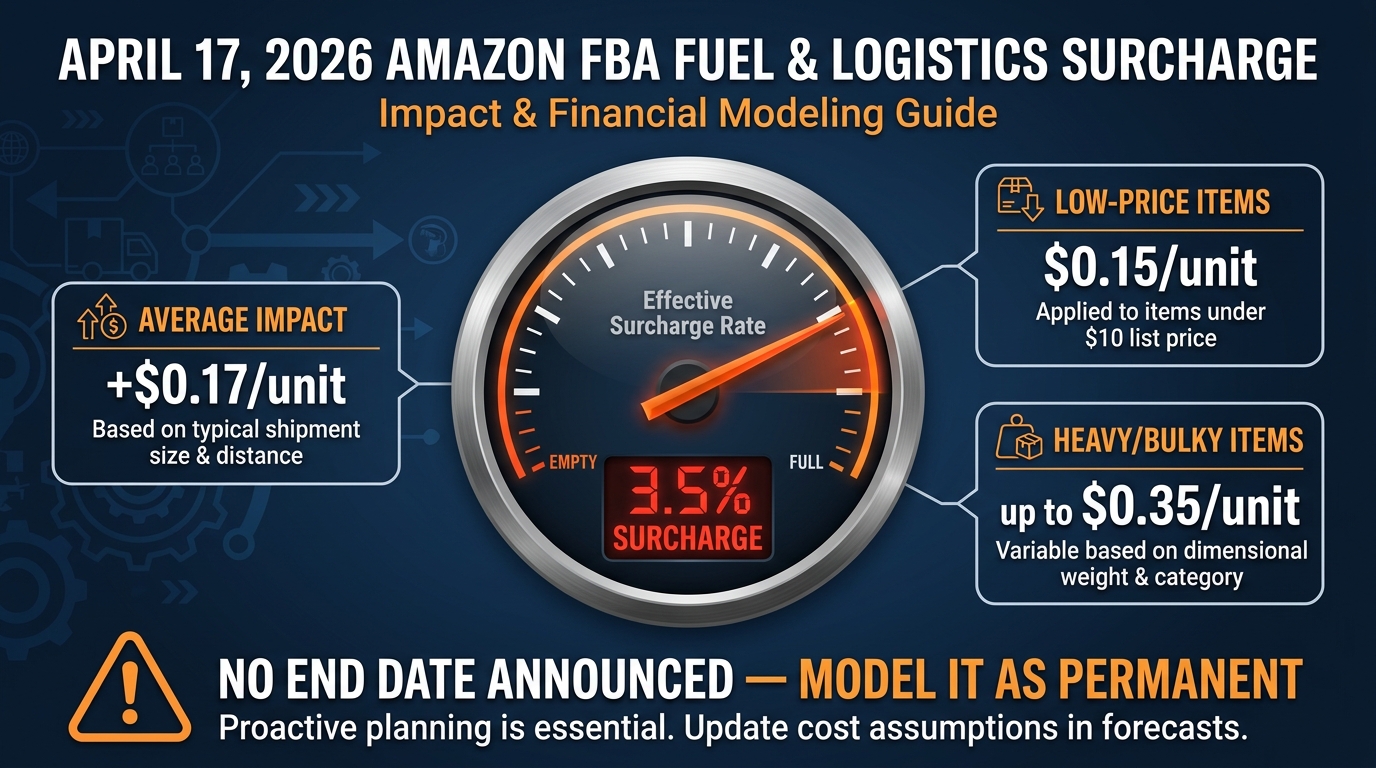
A 3.5% surcharge applied directly on top of the FBA fulfillment fee — not the selling price — that went live on April 17, 2026. Average impact across standard-size items is approximately $0.17/unit in the U.S. For heavier or larger items with higher base fulfillment fees, the dollar impact reaches $0.35/unit. No end date has been announced.
Inbound Placement Service Fee
Charged when Amazon determines that your inbound shipment configuration requires redistribution across fulfillment centers. In 2026, this fee increased by an average of $0.05/unit for standard-size products. The fee is variable: sellers who ship to a single FC (minimal shipment splits) pay the highest rate; those who split shipments across multiple nodes or use Amazon Warehousing and Distribution (AWD) as a staging layer pay less or avoid the fee entirely.
Low-Inventory Level (LIL) Fee
Applied when your inventory coverage falls below a threshold Amazon considers adequate for the historical sales rate of that FNSKU. The critical 2026 update: this fee is now calculated at the FNSKU (variant) level, not the ASIN level. For brands with multi-variant products — size ranges, color sets, bundled configurations — this means each variant is evaluated independently, and a stockout on one variant generates a fee even if the parent ASIN overall has adequate coverage. High-variation catalogs can see this fee multiply significantly relative to prior years.
Monthly Storage Fees
Charged on average daily cubic feet per calendar month. Standard-size rates are approximately $0.78/cu ft from January through September, and $2.40/cu ft from October through December during peak. Oversize runs $0.56/cu ft (off-peak) and $1.40/cu ft (peak). Storage fees held steady in 2026 at 2025 levels — one of the few bright spots in the fee structure. But with peak rates more than three times the off-peak rate, Q4 inventory planning remains one of the highest-leverage financial decisions a seller makes all year.
Aged Inventory Surcharge
Applies to inventory that has been at an Amazon FC for 181 days or more. The surcharge is applied per cubic foot and escalates with time. Items past 365 days attract significantly higher surcharge rates. For slow-moving SKUs with unpredictable demand cycles, the aged inventory surcharge is often the fee that quietly kills what appeared to be a profitable product.
Returns Processing Fee
Applied in categories Amazon designates as having high return rates, charged per returned unit. Amazon determines the rate by category and return frequency. In apparel, footwear, and some electronics categories, returns can run 20–30% of units sold — meaning the returns processing fee can represent a material cost-per-unit-sold even though it only triggers on actual returns. This fee needs to be modeled as a probability-weighted cost: expected return rate × per-unit return fee, added to your cost stack for every unit you sell.
Storage Utilization Surcharge
A less-discussed but real fee applied when your storage utilization exceeds certain thresholds relative to your sales volume. It primarily affects very large sellers but should be modeled as a scenario risk for brands scaling rapidly in Q4.
Account-Level Fees
The Professional selling plan ($39.99/month), co-op charges, chargeback fees, and any third-party service fees (prep centers, 3PLs, software subscriptions) that are real costs of operating on Amazon should be allocated per-unit or per-SKU as part of overhead burden, even if they don’t appear as Amazon-native charges.
The January 2026 FBA Changes: What Actually Moved the Needle
Amazon’s January 15, 2026 fee update was framed as modest — and headline-to-headline, it was. The average FBA fulfillment fee increase of $0.08/unit sounds trivial. At 10,000 units per month, that’s $800. At 100,000 units per month — a figure not unusual for a mid-market brand — it’s $8,000 monthly or roughly $96,000 annually. Not trivial at all when you’re fighting for margin in a competitive category.
The Size Tier Restructuring
The 2026 update also involved a restructuring of the size tier definitions for non-apparel goods. For sellers near the boundary of size tiers — particularly items close to the line between “large standard” and “small oversize” — the reclassification could push the per-unit FBA fee up by $1–$3 without any change to the actual product. This is why reviewing the Fee Preview report in Seller Central immediately after any fee announcement is non-negotiable. The item-level impact often differs substantially from what the headline average suggests.
What Sellers Expected vs. What Happened
Prior to the announcement, many sellers anticipated potential referral fee increases in high-volume consumer categories. Those didn’t materialize in the U.S. The absence of new fee types (no new categories were introduced in 2026 beyond the April surcharge) was also a partial relief. But the combination of small fulfillment fee hikes, size tier changes, and the pending April surcharge — which many sellers didn’t see coming in January — created a cumulative increase significantly larger than the $0.08/unit average implied.
Sellers who modeled their 2026 P&L based solely on the January announcement and didn’t rebuild after April are currently underestimating per-unit costs by $0.15–$0.35 on every FBA shipment.
The April 2026 Fuel & Logistics Surcharge: A Fee With No Expiry Date
The April 2026 fuel and logistics surcharge deserves its own section because it arrived differently from prior fee changes — mid-year, outside the usual January update cycle, framed as a response to macroeconomic conditions, and with no announced end date. That framing matters for modeling purposes.
How It’s Calculated
The 3.5% rate applies to the FBA fulfillment fee itself, not to the selling price. If your FBA fulfillment fee is $4.50/unit, the surcharge adds $0.158/unit — round it to $0.16. If your fulfillment fee is $9.80 (a common rate for mid-size oversized items), the surcharge adds $0.34/unit. The average across all U.S. FBA standard-size items works out to approximately $0.17/unit, but that average conceals significant variance by product type.
The surcharge applies to standard FBA fulfillment fees, Multi-Channel Fulfillment (MCF), and Remote Fulfillment from the U.S. to Canada and Mexico. It does not apply to referral fees, storage fees, or other service fees.
How to Model It Going Forward
The absence of a stated end date is the key planning variable. Amazon has used “temporary” surcharges before that proved effectively permanent after macroeconomic conditions normalized. The operationally correct approach is to model this fee as a permanent addition to your cost structure, then apply it as a positive scenario if it’s eventually removed. Building a P&L that expects the surcharge to disappear, and then discovering it hasn’t, is a planning error that compounds each quarter.
For sellers with COGS flexibility — particularly those sourcing from multiple regions — the surcharge also changes the math on sourcing decisions. A $0.17–$0.35 per-unit increase in fulfillment cost slightly shifts the cost-benefit calculation between FBA and Fulfilled by Merchant (FBM) for some SKU types, particularly in the $10–$20 price range where margins are already thin and fulfillment cost is a meaningful percentage of selling price.
The Psychological Tax
There’s a less quantifiable impact worth naming: mid-year fee changes outside the normal announcement cycle increase planning uncertainty. Sellers who locked in pricing for annual wholesale contracts in January are now operating at higher costs than their contracted prices were built to support. FBM operators who use third-party logistics services are seeing parallel cost increases from those providers, partially driven by the same fuel-cost dynamics Amazon cited. The surcharge is real, but the planning disruption it creates ripples beyond the $0.17/unit headline.
Inbound Placement & Low-Inventory Fees: The Hidden Per-Unit Tax on Complex Catalogs
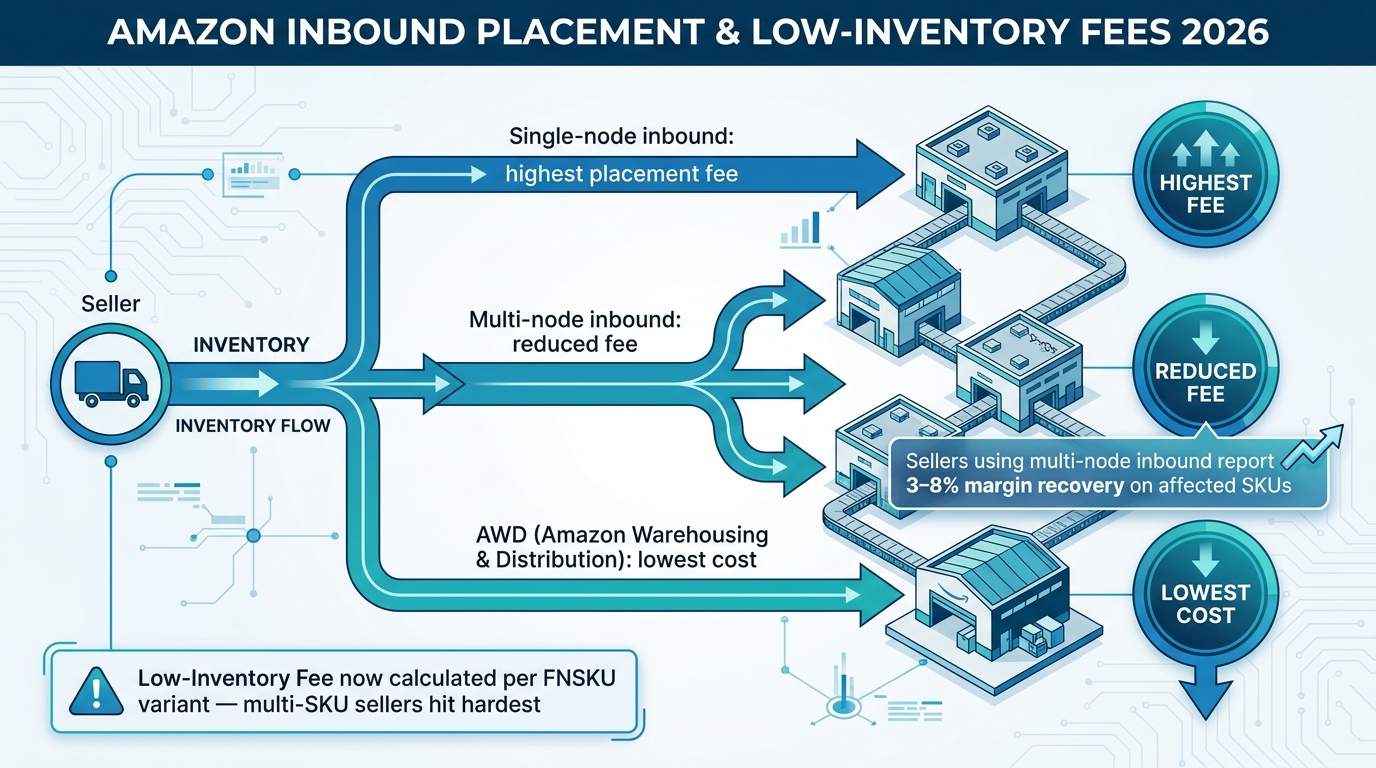
The inbound placement fee and the low-inventory level fee are the two additions to the Amazon fee stack that are hardest to model accurately — and that cause the largest surprise on financial reconciliation for sellers who don’t track them at the variant level.
Inbound Placement: The Logistics Tax on Simplicity
Amazon’s inbound placement fee reflects the cost Amazon incurs when it has to redistribute inventory across fulfillment centers after receiving it at a single location. Sellers who send all inventory to one FC are essentially shifting redistribution costs onto Amazon, and the placement fee is how Amazon recovers that cost.
The 2026 update increased the standard-size inbound placement fee by an average of $0.05/unit. That’s small in isolation. But the fee varies significantly based on how you ship: single-shipment-destination strategies attract the highest rate; partial splits across two or three FCs reduce it; full multi-node splits (shipping directly to Amazon’s preferred distribution points) or routing inventory through AWD first can bring the fee close to zero on eligible products.
For sellers shipping 50,000+ units per month, the difference between single-node and optimized multi-node inbound is not $0.05/unit — it can be $0.20–$0.50/unit depending on product characteristics. Annualized, that’s a $120,000–$300,000 swing on 50,000 monthly units. The sellers reporting 3–8 percentage point margin recovery on affected SKUs are almost entirely those who restructured their inbound logistics to qualify for reduced placement fees.
Low-Inventory Level: Why Variant-Level Tracking Is Now Mandatory
The low-inventory level (LIL) fee is charged when Amazon determines that your coverage days for a specific FNSKU have fallen below historical demand thresholds. The critical 2026 change is that this evaluation now happens at the FNSKU (variant) level.
Consider a brand selling a supplement in five flavors. Previously, if the combined ASIN had adequate inventory coverage, the LIL fee might not trigger even if one flavor was running low. Under the 2026 structure, each FNSKU is evaluated independently. If Flavor C has eight days of coverage while the threshold is fifteen days, Flavor C triggers the LIL fee — regardless of what the other flavors show.
For brands with broad variation depth — apparel in size/color combinations, consumables in multiple flavors, electronics in SKU/bundle combinations — the LIL fee under variant-level evaluation can represent a material cost increase versus what prior-year models predicted. The practical solution is either tighter variant-level forecasting (hard for many sellers to execute in existing demand planning systems) or deliberate inventory positioning that prioritizes coverage on high-velocity variants even at the cost of over-stocking lower-velocity ones.
The Logistics Re-Engineering Opportunity
The combined effect of inbound placement and LIL fees creates a clear operational advantage for sellers willing to invest in logistics design. The use of third-party logistics providers as staging facilities — receiving full container loads from overseas, breaking them into optimized multi-node shipments for FBA — has gone from a nice-to-have to a genuine margin lever. AWD (Amazon Warehousing and Distribution), while not the right solution for every seller, offers reduced placement fees for enrolled inventory and automatic replenishment to FBA. For sellers with consistent, high-volume SKUs, the AWD economics in 2026 often justify the program’s own fees.
Storage, Aged Inventory, and Returns: The Slow Drain You Don’t See Until Q4
The three storage-adjacent fees — monthly storage, aged inventory surcharges, and returns processing — share a common characteristic: they don’t feel significant until they do. Each accrues gradually, shows up in disbursement reconciliation without fanfare, and is easy to rationalize as “just part of doing business.” In aggregate, they can represent 3–6% of total revenue on poorly managed catalogs — a number that would shock most sellers who haven’t modeled them explicitly.
Monthly Storage: The Peak Quarter Problem
Monthly storage rates are consistent with 2025 levels — one area where Amazon didn’t increase costs. But the rate structure remains punishing: $0.78/cu ft from January through September, then $2.40/cu ft from October through December. That’s a 3.1x increase for the same cubic foot of space during Q4.
The implication for P&L modeling is that inventory decisions made in August and September carry a dramatically different financial profile than decisions made in March. A seller holding 5,000 cubic feet of inventory at an Amazon FC in September faces $3,900/month in storage fees. That same inventory in November costs $12,000/month. If the inventory doesn’t sell by November 15 — the typical cutoff for holiday delivery windows — you’re paying peak storage rates through December while your sales velocity is declining and your cash is tied up in working capital.
The correct P&L approach is not to use an average annual storage rate per unit. It’s to model storage cost separately for Q4-destined inventory and off-season inventory, using the actual monthly rate that will apply during the time that inventory is expected to sit in an FC.
Aged Inventory Surcharge: The Slow Product Tax
The aged inventory surcharge begins at 181 days and escalates beyond 365. For most healthy catalogs with adequate turnover, this fee is negligible. For any product that’s showing declining velocity — seasonal items that didn’t sell through, products disrupted by a competitor price cut, new launches that underperformed demand forecasts — the aged inventory surcharge is often the signal that something needs to happen immediately. Either discount the product to accelerate sell-through, run a removal order, or dispose of the inventory. Waiting rarely improves the economics.
In the P&L model, aged inventory surcharge should be treated as a scenario cost, not a zero. Any SKU with coverage days exceeding 120 should have an aged inventory cost modeled as a probability-weighted risk. If there’s a 20% chance a product hits 181 days, apply 20% of the relevant surcharge rate as a per-unit cost in your expected value model.
Returns Processing: The Fee That Scales With Return Rate
Returns processing fees apply in categories Amazon designates as having high return rates. The per-unit fee varies but in apparel and footwear categories can be meaningful when return rates reach 20–30%+ of units sold. For a product selling at $40 with a 25% return rate and a $1.50 returns processing fee, the expected per-unit cost of returns processing is $0.375 — not a line item you want to forget when modeling a 15–20% margin target.
Beyond the direct fee, returns have an indirect cost: returned units that cannot be re-sold as new (damaged, opened, or categorized as unfulfillable) represent total COGS loss on those units. For categories with high return rates and products susceptible to condition downgrade, the true economic cost of a return is closer to the full COGS of the unit than the returns processing fee alone.
Advertising as a Fee Line: Where TACOS Fits Into Your Unit Economics
Amazon advertising has never appeared as a “fee” in Amazon’s fee schedule, but in 2026, excluding it from your unit economics model is simply wrong. The average TACOS (total advertising cost of sales, expressed as a percentage of total revenue including organic sales) for active FBA sellers runs in the 8–18% range depending on category competitiveness and catalog maturity. For brands in hyper-competitive categories or those reliant on Sponsored Products to drive most of their sales, TACOS can reach 20–25%.
Why ACOS Alone Misleads You
ACOS (advertising cost of sales, expressed as a percentage of ad-attributed revenue only) is the metric Amazon’s advertising console shows by default, and it’s the metric most sellers optimize against. The problem is that ACOS doesn’t tell you what advertising costs as a share of your overall revenue — including organic sales that were driven or supported by the same advertising activity. A brand with $1M in total monthly revenue, $150,000 in ad spend, and $500,000 in ad-attributed revenue has an ACOS of 30% but a TACOS of 15%. Those are very different profitability pictures.
For P&L modeling purposes, use TACOS. And specifically, use SKU-level TACOS calculated by attributing ad spend to the specific ASINs being advertised — not a blended account-level average. The ASIN you’re spending most of your ad budget on might have a TACOS of 22%; the ASIN benefiting from halo traffic from that spend might have an effective TACOS of 4%. Blending them obscures both the cost of the aggressive SKU and the profitability of the halo beneficiary.
Setting TACOS Targets That Tie to Margin
The right way to set TACOS targets is backwards from contribution margin. If your target contribution margin for a SKU is 20% and your current non-advertising costs (COGS + all Amazon fees) consume 65% of revenue, you have exactly 15% of revenue left to allocate to advertising before hitting your margin floor. Your maximum sustainable TACOS is 15%. Any ad spend above that is eroding margin. Any spend below it is leaving available profit on the table if the marginal spend would have been ROAS-positive.
This approach — deriving TACOS ceilings from contribution margin targets — is far more precise than optimizing ACOS to a target that was itself chosen somewhat arbitrarily. It also makes it immediately obvious when category-level ad inflation (rising CPCs) is making a SKU structurally unprofitable to advertise, which is the signal to either reprice, reduce ad spend, or deprioritize the SKU in catalog strategy.
Building a SKU-Level Contribution Margin Model That Actually Works
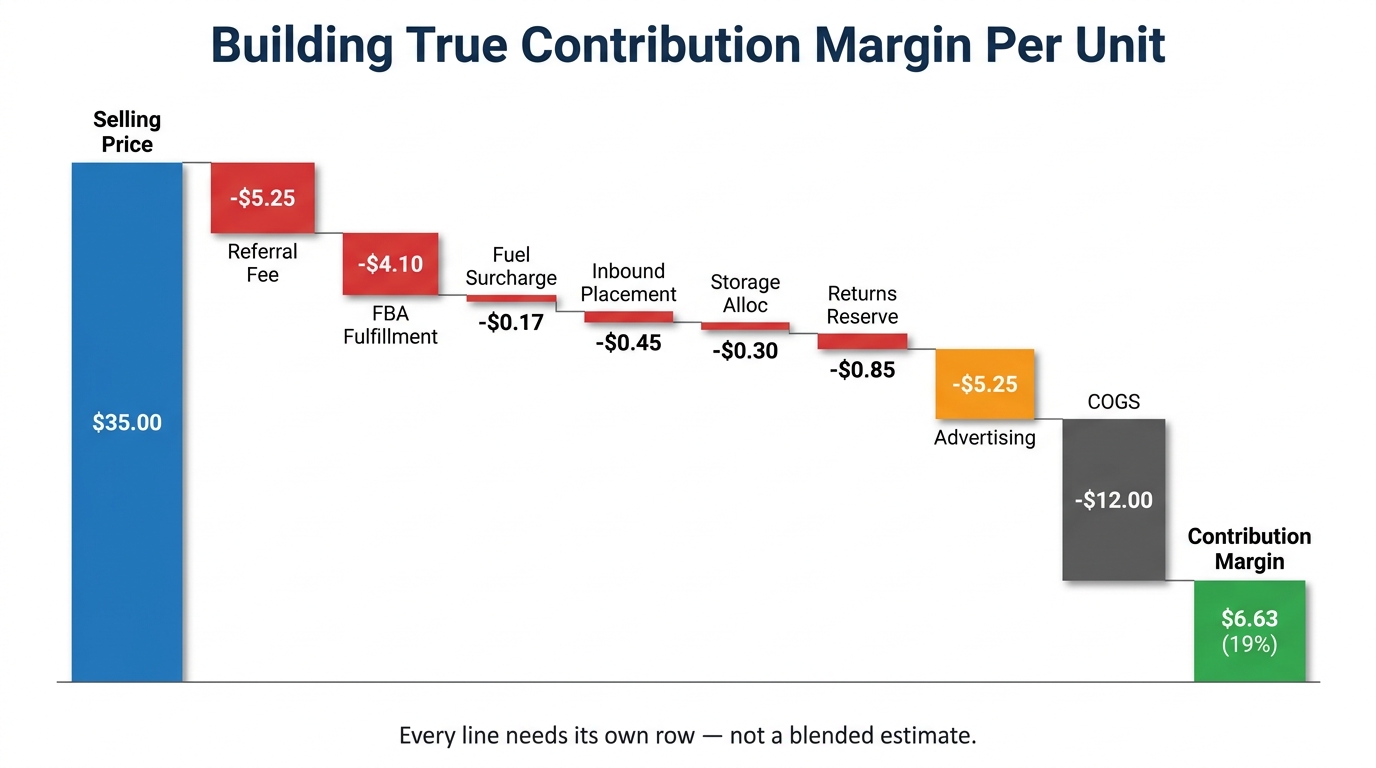
The architecture of a functional 2026 contribution margin model is not complicated — but it requires discipline in data collection and honest accounting of every cost layer. Here’s how to build it.
The Per-Unit P&L Structure
Start with net selling price: the actual average selling price per unit after coupons, promotions, lightning deals, and any price-matching activity. Amazon shows you gross revenue but the operative number for P&L purposes is net revenue — what actually lands in your account per unit after buyer-side discounts are applied.
From net selling price, subtract in order:
- Referral fee (category rate × net selling price)
- FBA fulfillment fee (from the Fee Preview report, per ASIN)
- Fuel & logistics surcharge (3.5% × FBA fulfillment fee)
- Inbound placement fee (per-unit allocation from inbound shipment fee reports)
- Storage cost allocation (average daily volume × applicable monthly rate × holding days / units sold, calculated separately for on- and off-peak months)
- Aged inventory risk (probability-weighted surcharge for SKUs with coverage days > 90)
- Returns reserve (expected return rate × [returns processing fee + percentage of COGS for unfulfillable returns])
- Low-inventory level fee allocation (from the FBA Fee report, per FNSKU)
- Advertising allocation (TACOS as a percentage of net selling price, per ASIN)
- COGS (fully landed: product cost + freight + import duties + prep)
What’s left after all of those subtractions is your contribution margin per unit. That is the only number that actually matters for operational decisions.
Working With the Data
The practical challenge is that some of these line items require pulling data from multiple Seller Central reports and joining them at the ASIN or FNSKU level. The FBA Fee report gives you actual per-unit fulfillment fees. The Inventory Health report gives you storage utilization and days of supply. The Advertising console gives you ASIN-level spend. The Business Report gives you revenue by ASIN. None of these come pre-joined, which is why most sellers don’t do this analysis — and why those who do have a genuine informational edge over those who don’t.
For catalogs under 50 SKUs, this model can be built and maintained in a well-structured spreadsheet. For larger catalogs, the economics of a BI tool or specialist Amazon analytics platform (Sellerboard, ManageByStats, and similar tools) that automate the data joins and refresh daily start to make sense. The tool cost is almost always justified by the margin decisions it enables.
A Worked Example
Consider a standard-size consumer product selling at $35 on Amazon:
- Referral fee (15%): −$5.25
- FBA fulfillment fee: −$4.10
- Fuel surcharge (3.5% × $4.10): −$0.14
- Inbound placement (estimated): −$0.45
- Storage allocation (off-peak, moderate velocity): −$0.30
- Returns reserve (8% return rate): −$0.85
- Advertising (TACOS 15%): −$5.25
- COGS (landed): −$12.00
- Contribution margin: $6.66 (19%)
That 19% contribution margin is the number to manage against — not the gross margin of ($35 − $12 COGS) = $23, which sounds like a 66% margin and is completely useless for operational decisions. A seller relying on that gross margin number is vastly overestimating the profitability of this product. At peak storage rates (Q4), add another $0.80–$1.20 to monthly storage allocation — and contribution margin drops to 16–17%. At TACOS of 20%, it drops to 14.5%. These are not academic scenarios. They’re the real economics that determine whether the product deserves to remain in the catalog.
Catalog Rationalization: Which SKUs to Kill, Fix, or Double Down On
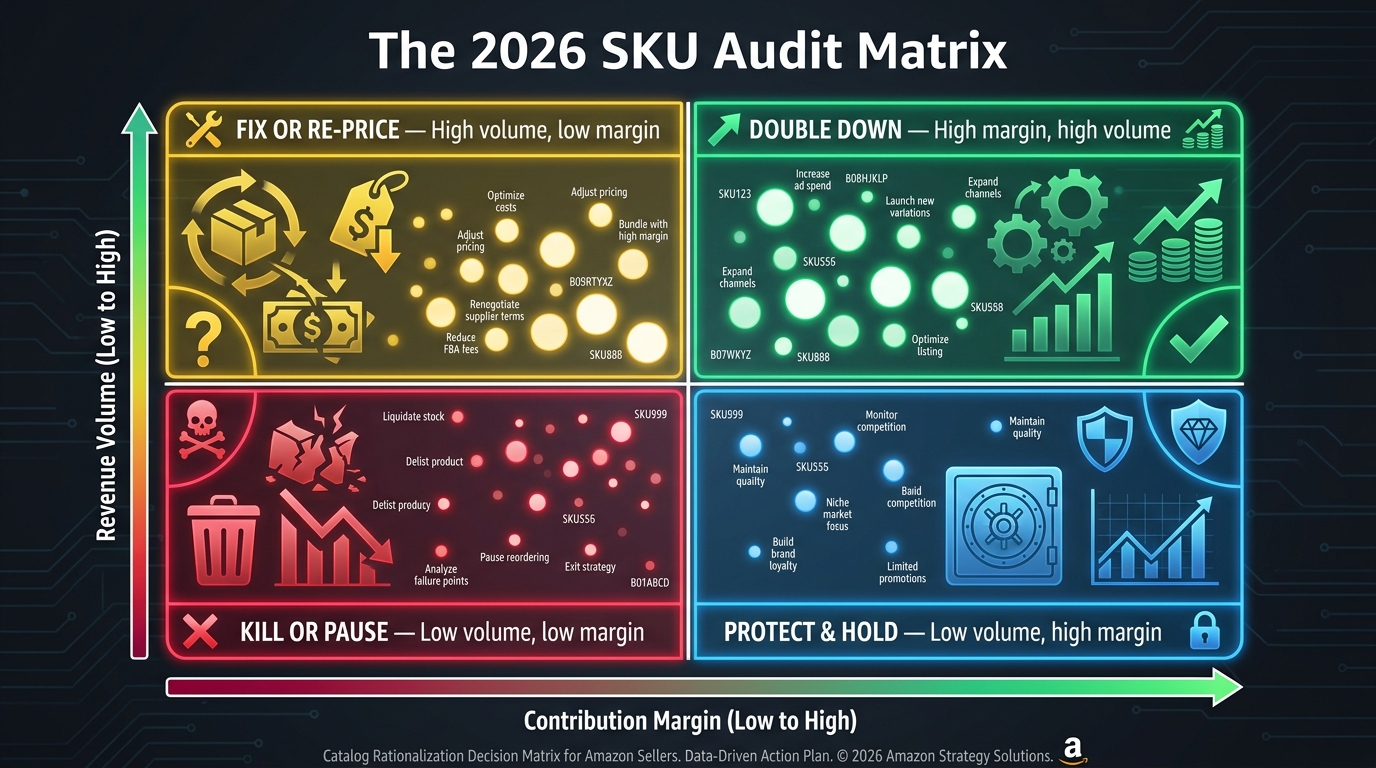
Once your contribution margin model is running at the SKU level, the most valuable use of the data is not revenue reporting — it’s catalog rationalization. The 2026 fee environment has made this exercise more urgent because the number of SKUs that were marginally profitable under older fee structures and are now actually loss-making is not trivial.
The Four-Quadrant SKU Audit
Map every active SKU on two axes: contribution margin percentage (x-axis) and monthly revenue volume (y-axis). This creates four quadrants, each requiring a different strategic response.
High margin, high volume (top right): These are your actual business. They deserve prioritized advertising investment, inventory coverage buffers, and active listing optimization. These SKUs are funding everything else. Protect them from operational disruption — stockouts on high-volume, high-margin items are the most expensive operational error you can make.
High volume, low margin (top left): These are the dangerous SKUs. They look important because of revenue size, but they’re consuming working capital, advertising budget, and operational bandwidth for thin or negative return. These require immediate action: price increase testing, ad spend reduction to minimum viable maintenance, COGS renegotiation, or packaging dimension optimization to reduce fulfillment tier. If none of those levers improve contribution margin to target within 60 days, this quadrant becomes the “kill or fix” list.
Low volume, high margin (bottom right): These are often underinvested opportunities. The margin is there; the volume isn’t. This is the quadrant that rewards targeted advertising investment and listing improvement. A small increase in conversion rate or traffic on a high-margin item moves the needle more per dollar of ad spend than the same effort on a low-margin item.
Low volume, low margin (bottom left): These should be candidates for removal unless there’s a specific strategic reason to keep them (e.g., catalog completeness, defensive listing, or a product in early-launch ramp before it’s built sales history). Every product in this quadrant represents working capital locked up in inventory, storage fees being paid monthly, and management attention being consumed. Many sellers are surprised by how many SKUs fall here once a real contribution margin analysis is run.
The Practical Rationalization Process
Catalog rationalization is not a one-time event. In the 2026 fee environment, it should run as a monthly process: pull updated contribution margin data for all active SKUs, re-map the quadrant positions, and act on any SKU that has migrated from a profitable quadrant into a marginal one. Fee changes, rising CPCs, COGS inflation, and category competition all shift a SKU’s quadrant position over time. A monthly review catches drift early; a quarterly review catches it after it’s already cost money.
For SKUs being removed from the catalog, the removal order versus disposal decision deserves its own model. Amazon charges removal fees per unit (approximately $0.97 for standard-size items). If the units can be liquidated through another channel — direct-to-consumer, Walmart Marketplace, eBay, or a liquidator — at a recovery price above the removal fee plus handling, removal is better than disposal. If not, disposal at lower per-unit cost stops the storage fee clock faster.
Working Capital and the DD+7 Cash Flow Gap
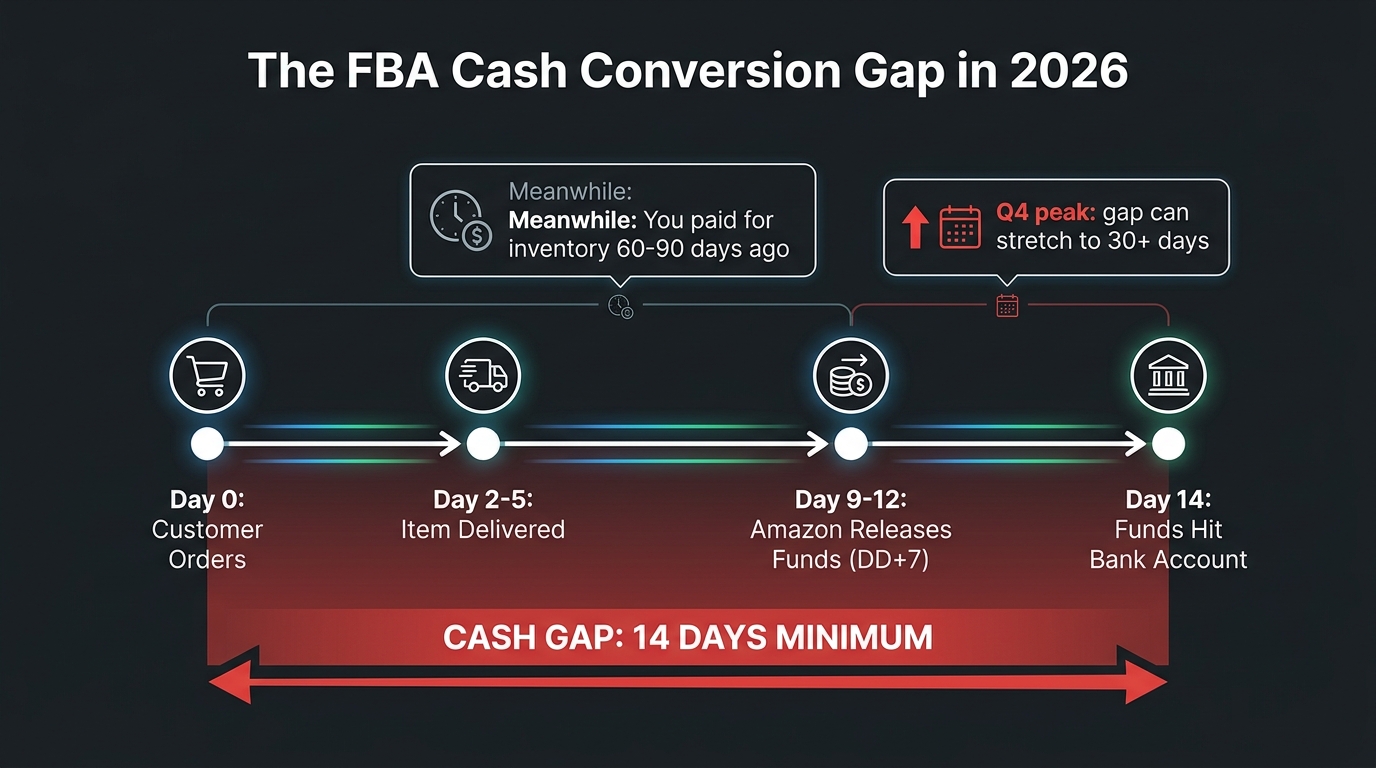
The P&L model captures profitability. But profitability and cash flow are not the same thing — and in 2026, the gap between them for Amazon sellers has widened in a way that needs to be explicitly modeled.
How DD+7 Changes the Cash Cycle
Amazon’s DD+7 policy, effective March 12, 2026, releases seller funds seven days after confirmed delivery of an order — not seven days after the order is placed. For a standard FBA order, that means: order placed (Day 0), delivery confirmed (typically Day 2–5), funds released (Day 9–12), funds available in your bank account (Day 14+). Under prior disbursement policies, the timeline was slightly shorter. The practical effect of DD+7 is that every dollar of Amazon revenue you expect to receive arrives at least two weeks after the sale, and often three weeks when processing time is included.
That seems manageable until you map it against your inventory financing cycle. If you’re sourcing from Asia, your payment-to-delivery cycle is typically 60–90 days (30–45 days for production, 20–30 days for ocean freight, customs, and delivery to your 3PL or prep center). You pay for inventory 60–90 days before it generates any revenue. Then you wait another 14+ days after sale for the cash to arrive. Your cash conversion cycle for Amazon FBA in 2026 can be 75–105 days. For any business running on thin working capital, that’s a structural stress.
Q4 Amplification
The working capital problem is most acute in Q4. Sellers typically place their largest inventory orders in August and September, paying suppliers 60–90 days before holiday sales. Peak FBA sales occur in November and December. But Amazon’s disbursement cycle during Q4 is also slower — higher transaction volumes, holiday payment processing, and reconciliation of promotions all extend the period between sale and cash receipt. Some sellers report effective cash conversion cycles of 30+ days during peak Q4. Combined with the largest inventory investment of the year, Q4 is the single highest-risk period for a cash flow crunch.
Modeling Working Capital Cost Into Your P&L
If your business finances inventory via a line of credit, factoring, or revenue-based financing, the cost of that financing should appear in your P&L model as a per-unit cost. At an 18% annual rate (a common range for short-term business credit), financing $20,000 of COGS for 90 days costs $900 — $0.09/unit on a 10,000-unit order. At $100,000 of COGS, the financing cost is $4,500, or $0.45/unit. For low-margin products, this is not a trivial number. Include it.
If your business is self-funded and you don’t have an explicit cost of capital, use an opportunity cost rate (typically 8–15% annualized) to represent the return you could earn deploying the same capital elsewhere. Ignoring the cost of capital because you don’t have a loan payment doesn’t mean the capital is free — it means the cost is hidden from your model.
P&L Stress Testing: Modeling Fee Changes Before They Hit Your Account
The most underused application of a rebuilt P&L model is stress testing: running controlled scenarios to understand what happens to contribution margin when specific variables change. In 2026, with fee changes arriving at irregular intervals and macroeconomic variables (tariffs, fuel costs, exchange rates) shifting unpredictably, this capability is the difference between managing your business reactively and managing it prospectively.
Building Scenarios Into Your Model
A properly structured contribution margin model can be stress-tested by adjusting any single input and observing the impact on the margin line. Useful scenarios to run on every active SKU:
- Fee escalation scenario: What does contribution margin look like if Amazon increases FBA fees by $0.50/unit? This is not a current announcement — it’s a planning exercise. If a $0.50 increase would push a SKU below your minimum contribution margin threshold, that SKU is structurally fragile and needs either a price increase or cost reduction buffer built now.
- TACOS inflation scenario: What happens to contribution margin if CPC costs rise 20% in your category? For any SKU where advertising represents 12%+ of revenue, CPC inflation is a margin risk that needs to be modeled explicitly.
- Return rate deterioration: If a product’s return rate increases from 8% to 15% (which can happen with a single negative review trend), what’s the contribution margin impact? For some SKUs, a 7-point increase in return rate turns a marginally profitable product into a loss.
- COGS inflation scenario: With tariffs on imported goods remaining a live variable in 2026, what happens to your margin if COGS increases 15%? Can you absorb it, re-price to compensate, or does the SKU need to be exited?
- Seasonal storage scenario: What’s the contribution margin on any Q4-targeted product if it achieves only 70% of projected sell-through? The remaining 30% runs up peak storage rates for weeks or months, and the margin on the sold units needs to be strong enough to subsidize the storage cost of the unsold ones.
Setting Your Minimum Viable Margin Threshold
Every contribution margin model needs a threshold below which a SKU is considered unprofitable and scheduled for remediation or removal. What that threshold should be depends on your business overhead structure — a lean operation with no employees and minimal fixed costs can survive on lower per-SKU contribution margins than a brand with a full team, a physical office, and extensive marketing programs. A common guideline is 15–20% contribution margin as the minimum for a sustainable FBA business, but the right number for your business comes from your own overhead model.
Set the threshold explicitly, apply it consistently, and review it quarterly. A contribution margin threshold that’s only applied when you’re feeling anxious about cash flow isn’t actually a management tool — it’s a rationalization framework.
The P&L Model as a Competitive Asset — Not Just a Finance Exercise
The instinct is to treat P&L modeling as a finance function: something that accounting does periodically to tell you how the business is performing. In 2026, for an Amazon seller, that framing misses the real value of the exercise.
Why P&L Clarity Is Now a Competitive Moat
When most of your competitors are operating on incomplete or outdated P&L models, a seller with a complete, current, SKU-level contribution margin model has access to information the market hasn’t priced in. They know which products they can profitably advertise more aggressively while competitors — unknowingly running similar products at breakeven — are pulling back. They know which price increases are safe to test because the margin math supports it. They know which products are worth investing in listing improvements and which aren’t.
More importantly, they can move quickly when Amazon announces a fee change. Instead of spending two weeks figuring out the impact, a seller with a current model can rerun their scenarios within hours of an announcement, identify the affected SKUs, and take action — repricing, adjusting ad budgets, or accelerating removal orders — before slower competitors have finished reading the announcement email.
Connecting Your P&L to Your Sourcing Strategy
The contribution margin model also feeds directly backward into sourcing decisions in a way that blended-average P&L analysis can’t. If your model shows that FBA fulfillment fees are the largest cost after COGS for a specific SKU category — which is often true for heavy, bulky items — that’s a product-design signal, not just a logistics cost. Products designed for density (high value-to-weight ratio) have structurally better FBA economics than low-density items at the same price point. A seller who understands this at the unit economics level will make different sourcing and product development decisions than one who looks at it only at the account P&L level.
Reporting Cadence That Keeps Your Model Current
A rebuilt P&L model depreciates if it isn’t refreshed regularly. The recommended cadence: update actual fee inputs once per month using the latest Seller Central fee reports; update COGS when purchase orders are placed; update TACOS weekly using your advertising console data; rerun stress scenarios after any Amazon fee announcement or macroeconomic disruption (tariff change, fuel cost spike). This is approximately 3–4 hours of work per month for a catalog under 100 SKUs in a well-structured model — and it is the highest-ROI operational activity available to most Amazon sellers in the current environment.
Stop Modeling the Amazon You Remember
The Amazon marketplace of 2026 has a fundamentally different cost structure than it did in 2022 or even 2024. The fee proliferation of the past three years has added complexity at a rate faster than most sellers’ P&L infrastructure has adapted. The result is a large cohort of sellers making consequential business decisions — which products to launch, how much to spend on advertising, how aggressively to price — based on models that are structurally incomplete.
Rebuilding your P&L model is not a glamorous project. It doesn’t generate revenue directly, and it doesn’t show up as a marketing win or a product launch. But in the 2026 competitive environment, it may be the single highest-leverage operational action available to most sellers. A catalog of fifty SKUs analyzed correctly will almost always contain five to ten products that look profitable but aren’t, and three to five that look average but are actually the business.
Finding those products — and acting on the information — is what separates sellers who are confused by margin compression from those who are managing through it.
Immediate Action Checklist
- Pull the Fee Preview report from Seller Central for your entire active catalog. Do this now and compare actual per-unit fees to what your model currently assumes — most sellers find at least three discrepancies.
- Add the April 2026 fuel surcharge (3.5% × your FBA fulfillment fee) to every SKU in your model. Treat it as permanent.
- Check your LIL fee exposure at the FNSKU level for every variant family in your catalog. Any variant with coverage days under 15 should be flagged for inventory replenishment and fee audit.
- Calculate TACOS — not ACOS — for your top 20 revenue ASINs and compare it to your contribution margin model to derive your sustainable ad spend ceiling per SKU.
- Run the four-quadrant SKU audit and identify any products in the low-margin, high-volume quadrant. These are your priority candidates for repricing or removal within the next 90 days.
- Model your Q4 storage cost explicitly, assuming peak rates from October through December, before placing any inventory orders for the holiday season.
- Set a contribution margin minimum threshold for your catalog and apply it consistently as a decision rule — not a retrospective explanation.
The fee stack isn’t going to simplify. Build the model that reflects the reality, not the one that felt adequate three years ago.