


The Amazon marketplace of 2026 is not the same landscape that early movers navigated a decade ago. The days of listing a generic product, running a handful of ads, and watching revenue climb are largely behind us. Today, approximately 9.7 million sellers have registered on Amazon worldwide, with roughly 2 million actively selling at any given time. Amazon’s total net sales reached $716.9 billion in the most recently reported full year — up 12.4% year over year — and the platform shows no sign of slowing its expansion into new markets, new product categories, and new fulfillment models.
That scale creates both extraordinary opportunity and genuinely fierce competition. The sellers who are building durable, profitable businesses in this environment aren’t necessarily the ones with the largest budgets or the most years of experience. They’re the ones who treat Amazon as a system — one with interconnected levers that must be understood, measured, and managed with consistency.
This guide is not about shortcuts or quick-win hacks. It’s a comprehensive, operational playbook covering every major pillar of a serious Amazon business: choosing the right model, researching products with depth, optimizing listings to convert, winning the Buy Box, managing inventory without bleeding cash, protecting your account health, building a review foundation that lasts, expanding internationally, and using data to make smarter decisions at every turn. Whether you’re a newer seller trying to avoid common traps or an experienced operator looking to tighten your processes, the frameworks in this guide are built for the realities of selling on Amazon in 2026.
Choosing Your Business Model: The Decision That Shapes Everything
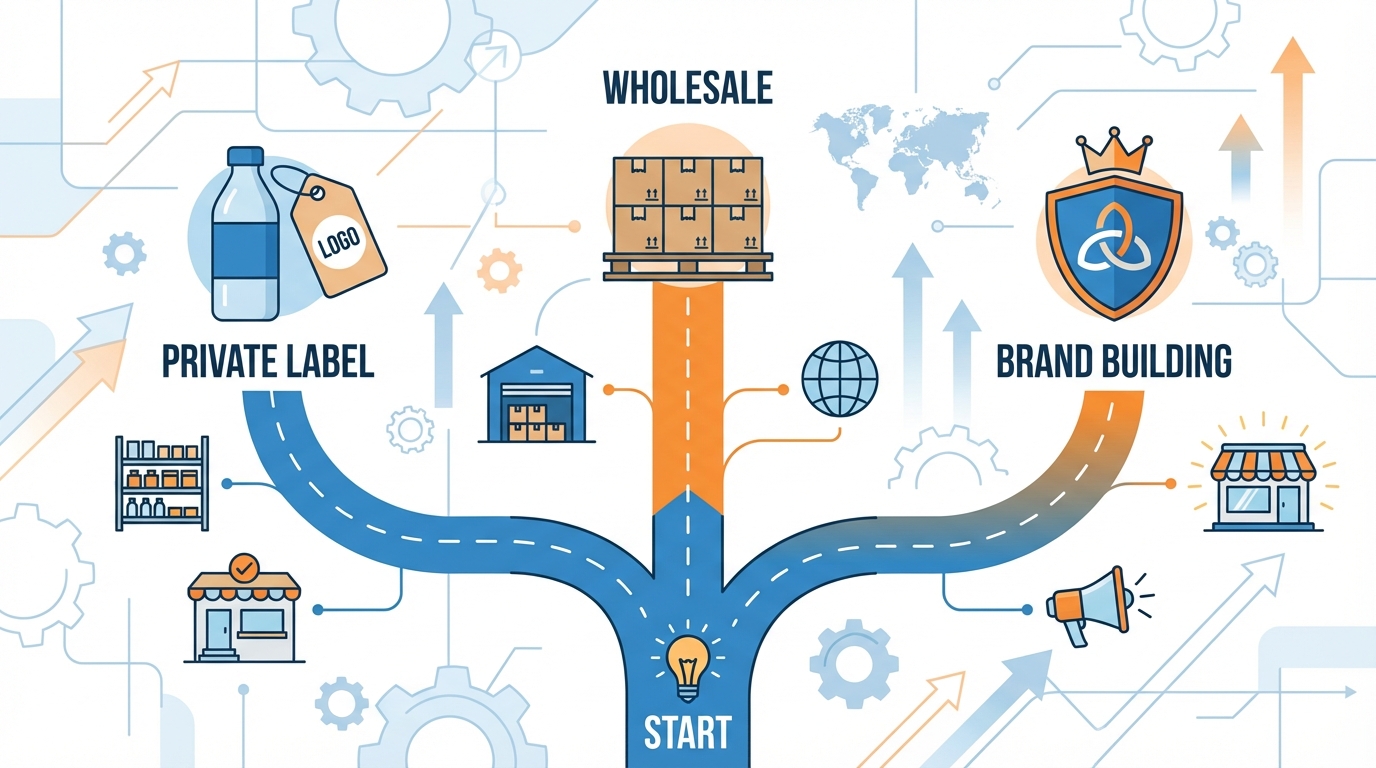
Before you research a single product or place a single order, the most consequential decision you’ll make is which business model you’re building. The three dominant models — private label, wholesale, and brand building — each carry distinct economics, risk profiles, time-to-revenue expectations, and long-term exit potential. Getting this choice right is foundational.
Private Label: Building Owned Assets with Higher Ceilings
Private label remains the most widely adopted strategy among serious Amazon sellers, representing roughly 54% of the seller population according to Jungle Scout’s ongoing data. The model involves sourcing generic or lightly customized products, typically from overseas manufacturers, and selling them under your own brand name. You own the listing, you control the content, and you own the intellectual property.
The financial profile is attractive: private label margins typically range from 25% to 50%+ depending on the category, manufacturing relationships, and how tightly you manage logistics costs. More importantly, the brand you build becomes a transferable asset. Businesses with established private label brands and stable Amazon sales histories are regularly valued at 3x to 5x annual revenue in acquisition markets — a multiple that wholesale-only businesses rarely achieve.
The tradeoff is capital intensity and time. Getting a private label product to market — including product development, sampling, manufacturing, photography, and launch inventory — typically requires between $3,500 and $10,000 or more as a starting investment. And the early months require patient investment in reviews and PPC before organic momentum builds.
Wholesale: The Lower-Risk On-Ramp
Wholesale involves purchasing established branded products from authorized distributors or manufacturers and reselling them on Amazon. You’re not creating anything new — you’re competing on price and fulfillment efficiency for existing demand. Startup costs are considerably lower, typically $1,000 to $5,000, and time-to-revenue can be as short as two to four weeks.
The margin compression is real, however. Wholesale margins on Amazon typically land in the 10% to 20% range after fees, and competition from other resellers (and sometimes Amazon itself) creates pricing pressure that’s difficult to escape. There is no brand equity building in this model, and the value of a wholesale Amazon business is rarely high enough for a meaningful exit.
Where wholesale genuinely shines is as a learning accelerator and cash flow generator. Many experienced sellers use wholesale revenue to fund their private label development — generating steady, if modest, income while they build something more proprietary on the side. It’s a pragmatic approach when capital is limited.
Brand Building: The Long Game
Brand building is an evolution beyond standard private label. It encompasses everything private label does but adds intentional work on brand identity, off-Amazon presence, multi-channel distribution, and customer loyalty. Brand builders are investing in their own websites, building email lists, running Meta and TikTok ads, and positioning Amazon as one revenue channel rather than the sole one.
This model requires the most resources and patience, but it also produces the most defensible businesses. A brand with cross-channel recognition, a loyal customer base, and proprietary product IP is far less vulnerable to Amazon’s algorithmic shifts, fee increases, or copycat competitors than a seller whose entire business lives inside a single Seller Central account.
The right model for you depends on your current capital position, risk tolerance, time horizon, and ultimate goals. But understanding the full spectrum before committing your resources is not optional — it’s the first act of running a serious Amazon business.
Product Research That Actually Works in 2026

Product research is where most new sellers make their most expensive mistakes. They gravitate toward high-volume categories with obvious demand and then discover, after investing in inventory, that those categories are dominated by established players with thousands of reviews, massive ad budgets, and deep supply chain relationships. The correct approach in 2026 is more surgical.
The Multi-Layer Validation Framework
Effective product research is no longer a one-step process of plugging numbers into a tool and acting on whatever comes back. The sellers consistently finding profitable niches are running a multi-layer validation process that confirms demand, competition, margin viability, and differentiation potential before committing a dollar.
Layer 1: Demand confirmation. Use tools like Helium 10’s Magnet or Jungle Scout’s Opportunity Finder to identify consistent search volumes. The benchmark for viable demand has shifted in competitive categories — aim for niches with at least 3,000 to 5,000 monthly searches for primary keywords, and confirm that demand is steady year-round using Google Trends. Highly seasonal products carry inventory risk that newer sellers consistently underestimate.
Layer 2: Competition assessment. The sweet spot remains products where the top five to ten listings have fewer than 200 to 500 reviews, or where existing listings have identifiable weaknesses — poor photography, thin bullet points, low-quality A+ content, or unresolved customer complaints visible in reviews. If every listing in a niche has 3,000+ reviews and professionally produced content, you’re not looking at an opportunity. You’re looking at an established market that will be expensive to penetrate.
Layer 3: Margin viability. Run the numbers before you fall in love with a product. Factor in the cost of goods, Amazon referral fees (typically 8–15% depending on category), FBA fulfillment fees, inbound shipping costs, and a realistic PPC budget for launch. For most categories, sustainable profitability requires achieving a minimum net margin of 20–25% after all costs. Products priced below $20 almost always fail this test once fees are fully accounted for.
Mining Reviews for Product Differentiation Intelligence
One of the most underutilized research tactics is systematic review analysis. Reading the one-star and two-star reviews on competing products tells you exactly what customers are frustrated by — which is, directly, what they would pay more for if solved. If every top competitor has negative reviews mentioning that a product’s handle breaks after two months, a version with a reinforced handle becomes a differentiated product with a genuine selling story. This is not a new idea, but the sellers who do it with discipline — cataloguing complaints by frequency and severity — extract real signal from what looks like noise.
Amazon’s own Product Opportunity Explorer, available inside Seller Central, now surfaces unfulfilled customer demand based on search query data. It shows you what customers are searching for, what products they’re clicking on, and what gaps exist between search intent and available supply. This tool remains underused by the broader seller community, which is precisely why it’s still producing actionable intelligence for those who make it part of their regular workflow.
The TikTok-to-Amazon Signal Pipeline
An increasingly productive research workflow in 2026 involves identifying viral product momentum on TikTok Shop first, then validating whether Amazon demand is materializing or growing before competitors flood the listing space. Products that have demonstrated emotional resonance on short-form video — particularly in beauty, wellness, kitchen, and home organization — often see Amazon search volume increases of 40–80% within 60 to 90 days of going viral on social. Sellers who spot these signals early and have supply chain relationships that allow fast product procurement have a meaningful timing advantage.
Winning the Listing Optimization Game

Once you have a product, the listing is your most critical revenue-generating asset. It is the point where all traffic — organic, paid, or external — either converts or exits. A poorly optimized listing is functionally a broken page, and no amount of advertising spend will compensate for a listing that fails to earn the visitor’s trust and action.
Title, Bullets, and Description: Writing for Both the Algorithm and the Human
Amazon’s A10 algorithm (and the newer AI-driven ranking factors introduced through 2025 and 2026) indexes listings for relevance based on keyword presence, search query performance data, and conversion signals. But conversion — the actual act of clicking “Add to Cart” — is driven by humans reading your copy.
The practical implication is that you can no longer choose between SEO optimization and persuasive copywriting. You have to do both, simultaneously, in the same words. The title should lead with the primary keyword naturally embedded in a readable product description, not a list of disconnected keyword fragments. Bullet points should use secondary keywords while directly addressing the customer’s primary concerns: what problem does this solve, what is it made of, and why is this version better than alternatives?
High-intent, long-tail keyword targeting has been shown to improve organic search rankings by approximately 20% for well-optimized listings. These aren’t the obvious head terms — they’re the specific phrases buyers use when they’re ready to purchase, not just browsing. Tools like Helium 10’s Cerebro and Amazon’s own Search Query Performance report inside Brand Analytics are the best sources for these terms because they’re drawn from real Amazon shopper behavior, not generic keyword databases.
A+ Content: The Conversion Multiplier That Many Brands Underinvest In
For brand-registered sellers, A+ Content is one of the highest-return investments in your listing. Data consistently shows that listings with A+ Content modules produce a 5–10% sales uplift on average, while multimedia-enhanced listings — those incorporating lifestyle photography, comparison charts, infographics, and brand story modules — drive up to 30% higher conversion rates than text-only equivalents.
The key word here is quality. Poorly produced A+ content — blurry images, generic messaging, no clear product differentiation — does not produce these results. The gains come from A+ content that does three specific things: it answers common pre-purchase objections, it communicates the product’s unique characteristics visually, and it makes the brand feel credible and established.
Premium A+ Content (available to sellers who meet Amazon’s eligibility criteria) adds further capabilities including video modules, interactive hotspots, and enhanced brand storytelling layouts. For competitive categories, the conversion gap between sellers using Premium A+ and those using basic listings is becoming difficult to ignore.
Images: The Highest-Impact Listing Element
Your main image is arguably the single most impactful element of your listing because it determines click-through rate from search results — and no one arrives at your carefully crafted A+ content if they never click. Standards for main images have risen significantly: white-background compliance is still required, but the quality of the shot, the angle, and the visual weight of the product in frame directly influence whether shoppers choose your listing over a competitor’s.
Secondary images tell the product story. The optimal image sequence in 2026 follows a consistent narrative: main product shot, key feature callouts, lifestyle context, size/scale reference, comparison or differentiation visual, and social proof (such as awards, certifications, or press mentions if applicable). Listings that follow this sequence, using professional-quality photography at every step, consistently outperform those that don’t.
The Climate Pledge Friendly certification badge, for qualifying products, has been shown to boost conversion rates by approximately 12% and allows sellers to command price premiums of 8–15% without significant conversion loss. For products that genuinely qualify, this certification is worth pursuing.
The Buy Box Algorithm: What Actually Drives Winning in 2026
For any seller competing in a category where multiple sellers share the same ASIN — whether through wholesale, arbitrage, or competing private label products — the Buy Box (now officially called the “Featured Offer” by Amazon) is the primary determinant of whether a sale happens for you or for a competitor. Understanding how it works in 2026 is operationally critical.
Total Landed Price: The Most Weighted Factor
Amazon’s Featured Offer algorithm evaluates total landed price — the combination of your product price and any shipping cost — not the list price alone. This distinction matters because competitors who inflate product prices while offering “free” shipping are not penalized the way they might be if only the base price were considered; Amazon sees through it and evaluates the full cost to the customer.
What’s changed in 2026 is that the competitive pricing window has narrowed substantially. Pricing tolerances that once allowed sellers to be 5–7% above the lowest offer while still retaining meaningful Buy Box share have compressed. In many categories, being more than $1.50 above the lowest total landed price on a $30 product — roughly 5% — now costs significant Featured Offer rotation. Automated repricing tools that react to competitor changes in real time have gone from a competitive advantage to something closer to a table-stakes requirement in competitive categories.
Fulfillment Method: FBA’s Persistent Structural Advantage
FBA sellers win the Featured Offer approximately three to five times more often than FBM (Fulfillment by Merchant) sellers at equivalent pricing. This advantage flows from two sources: Amazon’s inherent trust in its own fulfillment infrastructure for metrics like on-time delivery and customer service, and the growing weight the algorithm places on regional delivery speed.
Regional delivery speed — the system’s ability to get a product to a customer’s specific zip code within one to two days — now accounts for approximately 25–30% of the Buy Box weighting, up from roughly 15% in previous algorithm iterations. FBA sellers who are distributing inventory across Amazon’s fulfillment centers to optimize regional coverage have a meaningful structural advantage over those who ship all inventory into a single location and rely on Amazon to move it. Monitoring your Inventory Performance Index (IPI) and acting on Amazon’s replenishment recommendations is not just about avoiding storage fees — it’s directly influencing your Buy Box eligibility.
Seller Metrics: The Non-Negotiable Floor
No pricing or fulfillment strategy compensates for poor seller metrics. Amazon evaluates the following thresholds rigorously: Order Defect Rate (ODR) must remain below 1%, Late Shipment Rate (LSR) below 4%, and Pre-fulfillment Cancellation Rate below 2.5%. For FBA sellers, the last two are largely handled by Amazon — but ODR, which includes A-to-Z claims and negative feedback, remains your responsibility.
For high-performing sellers aiming for consistent Featured Offer ownership, the practical targets are tighter than these minimums: an ODR below 0.5%, an On-Time Delivery Rate (OTDR) above 97%, and a Valid Tracking Rate above 98%. These are the figures that separate sellers who occasionally win the Buy Box from those who own it reliably.
Inventory Management: Stopping the Cash Flow Drain
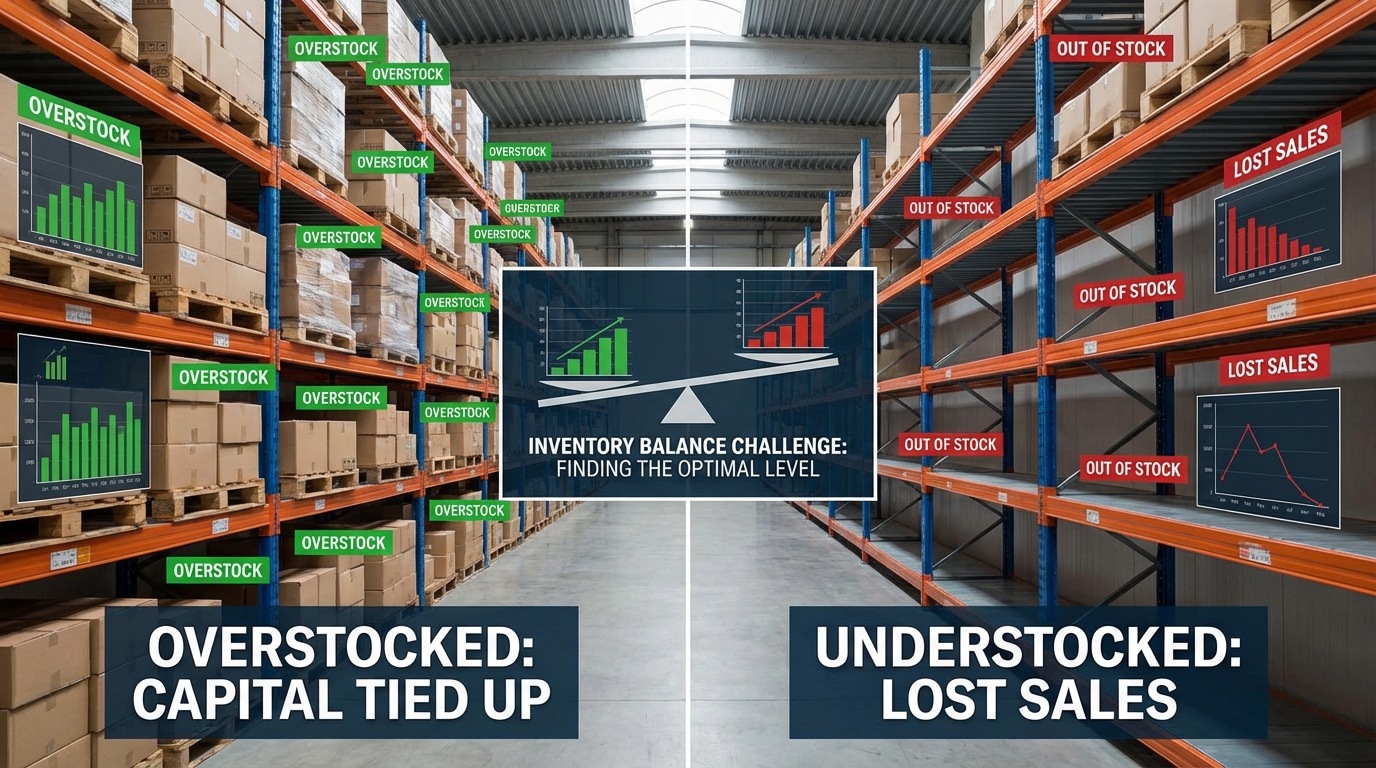
Inventory management is one of the most underappreciated drivers of Amazon seller profitability. Sellers who get this wrong lose money from two directions simultaneously: stockouts that kill organic ranking and forfeit sales, and overstock situations that generate escalating storage fees while tying up working capital. In 2026, with Amazon’s FBA storage fees reaching as high as $5.90 per cubic foot for inventory held beyond 181 days, the cost of poor inventory management is more visible than ever.
ABC Analysis: Not All SKUs Deserve Equal Attention
One of the most practical frameworks for managing a growing catalog is ABC analysis — classifying your products into three tiers based on their sales velocity and financial contribution to your business.
A items are your highest-volume, highest-impact SKUs. These deserve the tightest inventory controls, the most frequent review cycles, and the highest service levels in terms of safety stock. A stockout on an A item is not just a lost sale — it’s a ranking event. When an Amazon listing goes out of stock, its organic position degrades within days, and recovery can take weeks of PPC investment to restore.
B items get moderate attention. They’re valuable but not so critical that a short stockout represents a business emergency. C items — low-velocity, low-contribution products — are managed with lean stock levels and should be regularly evaluated for whether they’re worth the catalog management overhead and FBA fees they generate.
This tiered approach, applied consistently across your catalog, prevents the very common mistake of managing all products with the same urgency — which is functionally the same as managing none of them with the right urgency.
Demand Forecasting: Using Data to Anticipate Rather Than React
Reactive inventory management — placing restock orders only after a product approaches zero — is a recipe for repeated stockouts. By the time a reorder is placed, processed by the manufacturer, shipped, cleared by customs, and received by an FBA fulfillment center, six to twelve weeks may have passed depending on your supply chain. Sales velocity and historical seasonality data from the past two to three years need to be built into a rolling demand forecast, not just consulted when inventory dips.
Amazon’s own Inventory Performance Dashboard and the Restock tool inside Seller Central provide baseline forecasting recommendations, and for sellers with straightforward catalogs, these tools are a reasonable starting point. Sellers with larger SKU counts or more complex seasonality patterns often benefit from dedicated inventory management platforms — tools like Sumtracker, Skubana, or Inventory Planner — that allow for more granular forecasting parameters including lead time variability, supplier reliability scores, and event-driven demand spikes.
Safety Stock: The Insurance Policy You Should Be Paying For
Safety stock — a buffer of inventory held above your calculated reorder point to absorb unexpected demand spikes or supply chain delays — is not a luxury. It is the insurance policy that prevents a supplier delay or a sudden traffic surge from knocking out weeks of sales and ranking progress.
The practical calculation involves multiplying your average daily sales by your supplier’s maximum lead time and subtracting the average lead time equivalent. The difference is the buffer you should be holding. Yes, this ties up capital. No, it is not optional for A items in competitive categories where a two-week stockout can mean three months of ranking recovery work.
Account Health: Staying Safe in Amazon’s AI-Enforced Ecosystem
Amazon’s enforcement environment has shifted considerably in recent years. The platform now uses AI-driven compliance systems that flag violations faster, with less human review before action is taken. For sellers, this means that account health issues that might have taken weeks to surface and escalate in previous years can now trigger listing suppressions or account warnings within days. The implications for how sellers should structure their compliance practices are significant.
The Metrics You Monitor Weekly — Without Exception
Account health is not a once-a-month check-in. Sellers running serious businesses review their Account Health Dashboard at least weekly, checking the following key metrics against their known thresholds:
- Order Defect Rate (ODR): Must remain below 1%; targets below 0.5% for stable operations
- Late Shipment Rate (LSR): Must remain below 4% for FBM shipments
- Pre-fulfillment Cancellation Rate: Must remain below 2.5%
- Valid Tracking Rate (VTR): Must remain above 95%; targets above 98%
- Policy compliance status: Any open compliance cases or listing suppressions that require response
The purpose of weekly review is early detection. A metric trending in the wrong direction gives you time to diagnose and correct the root cause before it crosses a threshold. A metric discovered on the day it triggers a warning gives you no time at all.
Supply Chain Documentation: The First Line of Defense
Inauthenticity claims remain one of the most common causes of Amazon seller account suspensions in 2026, and they are also one of the most avoidable. Amazon increasingly requires sellers to demonstrate valid, traceable supply chains — meaning manufacturer invoices (not receipts), supplier agreements, and ideally certificates of authenticity or chain-of-custody documentation for higher-risk categories like supplements, electronics, and beauty.
This documentation needs to be stored, organized, and accessible. Sellers who cannot quickly produce supply chain evidence when Amazon requests it during an investigation are at serious disadvantage when trying to appeal a suspension. Building a systematic documentation habit — scanning and filing invoices by ASIN and supplier, maintaining updated supplier agreements, and keeping product testing certificates current — is a relatively low-effort precaution against a potentially business-ending event.
Listing Compliance: The Invisible Minefield
A significant proportion of listing suppression events stem not from bad intentions but from simple non-compliance with Amazon’s category-specific content guidelines. These include keyword stuffing in titles, claims that violate Amazon’s restricted claims policies (common in health, wellness, and supplements), incorrect variation groupings, and product images that don’t meet background or content standards.
Conducting a quarterly listing audit — reviewing all live ASINs against current Amazon content guidelines — catches these issues before they trigger automated enforcement. Given that Amazon’s content policy guidelines are updated regularly, what was compliant in a listing created eighteen months ago may not meet current standards. The audit cadence should increase to monthly for sellers in high-risk categories like supplements, electronics, or anything with safety-related compliance requirements.
Reviews in 2026: Building a Compliant Foundation After Amazon’s Variation Policy Shift
Customer reviews remain among the most powerful conversion and ranking factors on Amazon. Research consistently shows that products with steady, positive review accumulation can see sales increases of up to 50% relative to comparable listings with fewer reviews. But Amazon’s review compliance environment is simultaneously stricter and more technically complex than at any prior point in the platform’s history.
The 2026 Variation Review-Sharing Update: What Changed and Why It Matters
On January 7, 2026, Amazon announced a significant policy change affecting how reviews are shared across product variations. The rollout, phased in from February 12 through May 31, 2026, limits review aggregation across variations to those with only minor, non-functional differences — such as color, packaging size, or minor aesthetic variations. Products that differ significantly in function, ingredients, performance specifications, materials, or intended users will now have their reviews separated by variation rather than pooled across the parent listing.
The practical impact on sellers with broad variation strategies is substantial. Listings that were previously benefiting from aggregated review counts across significantly different product variants — for example, a supplement line with different formulations grouped under a single ASIN family — will see those review counts and star ratings split by variant. For child ASINs that have lower individual review volumes, this creates a measurable trust deficit that requires a deliberate response.
The right response is to audit your variation structure, identify which groupings will be affected by the new rules, and begin generating variation-specific reviews through compliant means before the full rollout completes. Listings where the review separation will create the greatest damage should be prioritized.
Compliant Review Generation: The Channels That Still Work
Amazon’s policies prohibiting incentivized reviews, purchased reviews, or any form of cherry-picking (asking only satisfied customers for feedback) have been in force since 2016 and have not softened. The enforcement mechanisms have only become more sophisticated, with AI systems now detecting patterns of coordinated review activity that human moderators previously missed.
The compliant channels that remain effective in 2026 are:
- The “Request a Review” button in Seller Central, which sends a standardized Amazon-branded request between 5 and 30 days after delivery. Automated scheduling tools apply this consistently across all orders without requiring seller manual action.
- Amazon Vine Program for pre-launch and early-stage review building on new ASINs. Vine provides early reviews from Amazon’s vetted reviewer network and is the most reliable way to establish a review base for brand-new listings without violating policy.
- Post-purchase insert cards that direct customers to the listing for feedback — with strict compliance requirements: the card must not incentivize positive reviews, must not direct customers to leave only positive reviews, and must not include language designed to filter out unhappy customers.
The “Voice of the Buyer” dashboard, which replaced the older “Buyer Reviews” interface in Seller Central, now gives sellers cleaner access to review analytics — including smart filters that can exclude reviews from customers who returned the product or who are on Amazon’s blacklisted reviewer lists for known manipulation patterns.
Going Global: Amazon International Expansion Opportunities for 2026

Approximately 45% of US-based Amazon sellers have already expanded to at least one international Amazon marketplace. For those who haven’t, the competitive dynamics and margin pressures in the US market make international expansion a more pressing consideration in 2026 than in previous years. The opportunity is real, the infrastructure is more mature, and the competition in most international markets remains meaningfully lower than in the US.
The High-Value Markets: Where the Opportunity Is Concentrated
Not all international Amazon marketplaces are created equal. The highest-value targets for most US sellers, based on a combination of revenue potential, logistics maturity, and competition levels, are:
- United Kingdom: Amazon UK is a well-developed, high-intent marketplace with a large Prime subscriber base and English-language content requirements that eliminate translation costs. Post-Brexit VAT compliance adds administrative overhead but is manageable.
- Germany: Amazon’s largest European marketplace by sales volume at approximately $38 billion annually. German consumers are known for high purchase intent and willingness to pay for quality — but also for high return rates, particularly in apparel and electronics, which must be factored into margin calculations.
- Japan: Amazon Japan generates approximately $26 billion in annual sales. Localization requirements are higher than English-speaking markets, but competition from international sellers remains relatively low, and Japanese consumer loyalty to quality brands is among the highest of any market.
- Australia and Canada: Both are English-language markets with lower competition than the US and growing Prime customer bases. Canada in particular benefits from shared North American supply chains, reducing the complexity of international fulfillment.
- UAE: Amazon has been making significant infrastructure investments in the UAE market, including micro-fulfillment centers designed to achieve 15-minute delivery windows. Competition is still low by global standards, and average order values in the UAE are among the highest of any Amazon marketplace.
For European expansion specifically, Amazon’s logistics investments are meaningful. The company committed €2.4 billion to fulfillment infrastructure in Belgium and the Netherlands alone, with benefits flowing to sellers through faster delivery and improved Prime eligibility across the EU.
The Practical Framework for Starting International Expansion
The most common mistake sellers make with international expansion is attempting too many markets simultaneously. A more disciplined approach is to treat international expansion as a sequential process: choose one market, validate your product-market fit there with a limited SKU selection, build operational knowledge of that market’s VAT requirements, content standards, and fulfillment options, and only then consider adding a second market.
For most US sellers, the UK or Canada represents the most logical first international market — English language content works directly, cultural preferences are reasonably aligned with US consumer behavior, and Amazon’s cross-border inventory programs reduce the complexity of maintaining separate FBA footprints. The additional revenue from even a single international market, running on existing product and content infrastructure, can meaningfully improve total business economics.
VAT Compliance: Don’t Skip This Step
VAT compliance is the most frequently underestimated complexity of European expansion. Selling into EU markets triggers VAT obligations that, if ignored, create significant legal and financial exposure. The EU’s One Stop Shop (OSS) program has simplified cross-border VAT filing for sellers who meet its eligibility requirements, but proper setup requires working with a VAT-registered accountant or compliance service familiar with Amazon’s specific reporting requirements.
Sellers who launch into EU markets without resolving VAT compliance first are not saving time — they are creating a future problem that becomes exponentially harder to unwind after months of non-compliant sales. Getting this right from the first sale is strongly advisable.
Data and Analytics: The Intelligence Layer That Separates Good Decisions from Guesses
Amazon generates an enormous volume of seller-facing data. The challenge is not access to data — it’s knowing which metrics actually drive decisions and which ones are noise. In 2026, the sellers making the best strategic choices are those who have built a coherent analytics framework around a small number of high-leverage metrics rather than attempting to monitor everything simultaneously.
The Core Dashboard: Metrics That Earn Weekly Attention
Amazon’s Custom Analytics inside Seller Central is the starting point for most data work. The metrics that deserve regular attention at the ASIN level include:
- Sessions and conversion rate: Sessions tell you how much traffic a listing is receiving; conversion rate tells you how effectively that traffic is being converted into purchases. A session trend without a corresponding conversion trend signals a ranking or traffic source change. A conversion drop on stable session volume signals a listing or pricing issue.
- Search Query Performance: Available inside Brand Analytics, this report shows the specific search queries driving impressions and clicks to your listings. It surfaces branded vs. non-branded discovery, identifies emerging keywords gaining traction, and reveals where competitor listings are intercepting searches that should be landing on yours.
- Buy Box percentage: For any ASIN where you compete with other sellers, your Featured Offer win rate is a direct revenue metric. A declining Buy Box percentage without a corresponding change in your own pricing or metrics is a signal that a competitor has changed their strategy or that a new entrant has appeared.
- Promotional conversion: This measures how effectively your discounts or coupons are converting the incremental traffic they generate. Promotions that drive traffic but don’t convert at meaningfully higher rates than organic traffic are destroying margin without building velocity.
Advertising Attribution: Connecting Spend to Outcomes
PPC advertising is typically one of the largest variable costs in an Amazon seller’s P&L — and one of the least well-analyzed. Amazon ad spend across the platform is growing at approximately 20% year over year, which means costs are rising even when your own campaigns are staying constant in bid levels. Understanding which campaigns and which keywords are actually contributing to profitable sales (not just any sales) requires attributing ad spend to individual ASINs at the SKU level and measuring the resulting contribution margin, not just ACOS (Advertising Cost of Sales).
Tools like Conjura and other multi-channel analytics platforms that unify Amazon attribution data with off-platform ad spend provide a more complete picture of where marketing dollars are genuinely producing returns. The shift from ACOS as the primary advertising KPI toward total advertising cost of sale (TACoS) — which measures ad spend as a percentage of total revenue including organic — has been one of the more productive analytical evolutions in the seller community. A high ACOS campaign may be entirely justified if it’s generating organic rank lift that reduces overall TACoS over time.
Inventory Analytics: Preventing Both Types of Loss
The analytics layer for inventory management should be tracking two distinct risk signals: stockout probability (when will I run out?) and overstock exposure (how much aged inventory am I accumulating?). Both require forward-looking metrics, not just backward-looking reports.
Days of stock on hand, reorder lead time, and average daily sell-through rate for each SKU tier should be producing proactive alerts at defined thresholds — not something you discover when checking Seller Central on a random Tuesday. For sellers with catalogs above 20 to 30 active SKUs, this type of systematic inventory intelligence is what separates a business that scales cleanly from one that constantly fights avoidable fires.
Building Long-Term Defensibility: What Separates Businesses That Last
There is a meaningful difference between an Amazon seller and an Amazon-based business. A seller is someone who exploits marketplace dynamics for revenue. A business is a structured entity with proprietary assets, operational resilience, and defensibility against the inevitable shifts in platform terms, competition intensity, and market conditions.
Intellectual Property: The Structural Moat
Trademark registration is the foundational IP protection for Amazon sellers, and it is the prerequisite for Amazon Brand Registry — which in turn unlocks A+ Content, Brand Analytics, the Vine program, enhanced reporting tools, and accelerated IP infringement enforcement. For any seller intending to build a private label brand, trademark registration in each market where you operate is not optional infrastructure. It is the legal foundation on which everything else sits.
Beyond trademark, sellers building genuinely differentiated products should be evaluating utility patent protection for functional innovations and design patents for distinctive product aesthetics. The bar for patent protection is real, but for products that have taken significant development investment to differentiate, patents provide the only true barrier to competitor replication that trademark and brand registry cannot offer.
Multi-Channel Revenue: The Resilience Imperative
Every seller who operates exclusively on Amazon is running a business with a fundamental structural vulnerability: a single point of failure that is entirely outside their control. Amazon can change fee structures, suppress listings, shift algorithm weightings, or enter your product category directly — and you have limited recourse in any of these scenarios if Amazon represents 100% of your revenue.
Building a meaningful revenue presence off Amazon — whether through your own DTC (direct-to-consumer) website, Walmart Marketplace, TikTok Shop, retail partnerships, or international marketplaces — is the primary structural insurance policy against platform risk. It also improves the quality and valuation of a business at exit: acquirers in the Amazon aggregator and private equity space place higher value on brands with diversified revenue than on pure-Amazon plays, particularly given the increased scrutiny of account health and fee trajectory that has characterized the marketplace in recent years.
Operations That Scale Without You
The final dimension of building for long-term dominance is removing yourself from daily operations gradually and systematically. Businesses that depend on the founder or owner for every critical decision — pricing changes, reorder timing, appeal responses, PPC adjustments — are operationally fragile and nearly impossible to scale or exit effectively.
Documenting standard operating procedures for every recurring process, training team members or virtual assistants to execute those procedures, and building audit mechanisms that allow you to verify quality without doing the work yourself are the operational building blocks of a scalable Amazon business. The sellers who achieve meaningful exits or build genuinely large operations are almost universally those who made the investment in process documentation and team development before they felt they had time for it.
Conclusion: Treating Amazon as a System, Not a Shortcut
The consistent theme running through every section of this guide is that sustainable Amazon selling in 2026 is a system, not a collection of individual tactics. Product research informs catalog decisions. Catalog decisions determine inventory requirements. Inventory management affects account health metrics. Account health affects Buy Box eligibility. Buy Box performance influences organic ranking. Organic ranking determines how much you spend on advertising. Advertising data informs further product and listing development. Every lever connects to every other lever.
Sellers who understand these connections — and who build their operating cadence around monitoring and improving the system as a whole — consistently outperform those who chase isolated optimizations. The seller who spends a month perfecting their PPC campaigns while ignoring a growing stockout risk or an unresolved listing compliance issue is optimizing one part of the system while allowing another part to degrade. The results reflect that trade-off.
Here are the actionable priorities that flow from everything covered in this guide:
- Choose your model deliberately and understand the economics of that model completely before committing capital. Switching models mid-stream is expensive.
- Validate products with multiple data layers before ordering inventory. Demand, competition, and margin viability need to be confirmed independently.
- Invest in listing quality with the same financial discipline you apply to inventory and advertising. A well-optimized listing is a compounding asset.
- Manage inventory as a financial system — stockouts and overstock are both forms of loss that must be minimized simultaneously.
- Review account health weekly and build documentation habits before you need them in a crisis.
- Treat reviews as infrastructure — build them through compliant channels consistently rather than trying to accelerate through risky shortcuts.
- Consider international expansion as a natural stage in business maturity rather than an optional add-on.
- Use data to make decisions, not to fill dashboards. Identify the three to five metrics that drive your most important decisions and monitor those with discipline.
- Build for resilience through IP ownership, multi-channel revenue, and operational systems that work without depending on your daily presence.
The Amazon marketplace rewards sellers who think long-term, execute with operational discipline, and treat their business as a system to be understood and managed — not a platform to be hacked for quick gains. The infrastructure Amazon provides is genuinely powerful. What you build on top of it is entirely up to you.