


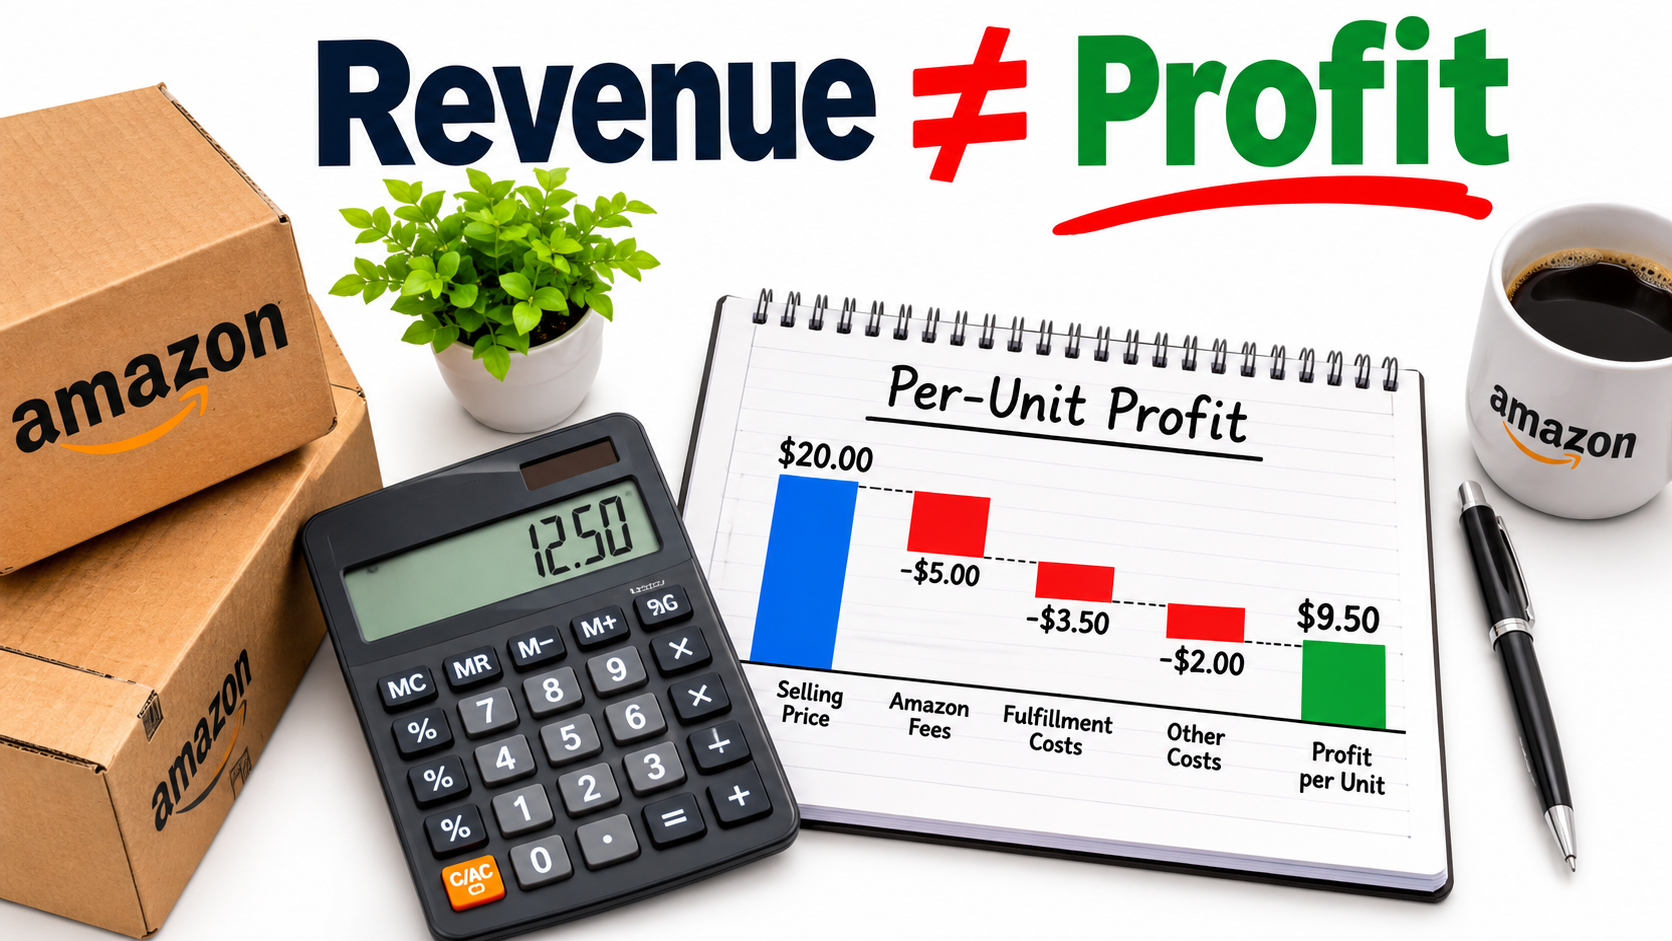

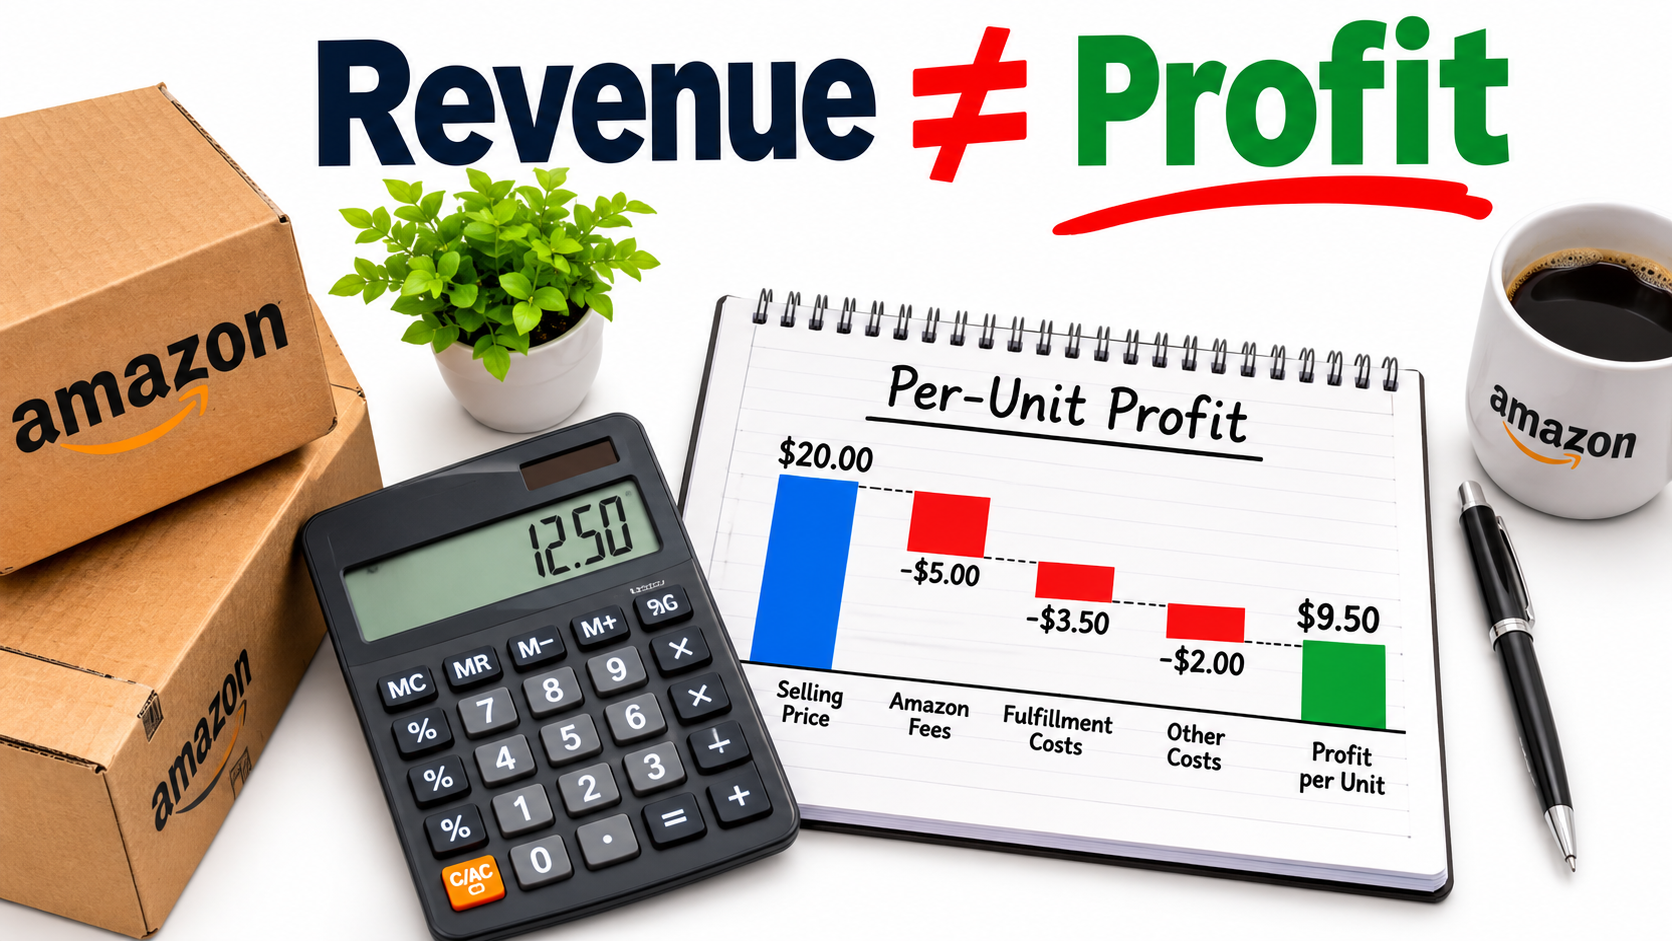
Most advice about Amazon selling is about getting sales: better keywords, better images, better ads. Far less is said about what happens to each dollar after the sale. That is where many seller businesses quietly fail.
A listing can rank on page one, sell hundreds of units a week, and still drain the owner’s bank account. The cause is usually not a lack of demand. It is a lack of clarity about per-unit profit and the timing of cash.
This article takes a different angle from the usual tactics list. It treats Amazon selling as a cash-flow business and gives you a framework for judging any product: contribution margin, ad-phase economics, the cash conversion cycle, returns, and reorder discipline.
A note on numbers: every dollar figure below is a hypothetical example built to show the arithmetic, not a market statistic. Fee rates change often and vary by category and size tier, so always check Amazon’s current rate card in Seller Central before applying this to your catalog.
Why Revenue Is the Wrong Scoreboard
Seller Central’s dashboard leads with ordered product sales. It is the number most sellers check first, and it is the least useful for decisions. Sales say how much money moved through your account, not how much stayed.
Two sellers can each report the same monthly revenue. One keeps a healthy margin and reinvests. The other has spent nearly everything on product, fees, ads, and inventory sitting in a warehouse.
The metrics that actually matter
- Contribution margin per unit: price minus every cost that scales with a unit sold.
- Net profit after ads: contribution margin minus advertising per unit.
- Cash conversion cycle: days between paying a supplier and receiving the payout.
- Return on inventory investment: profit generated per dollar of stock purchased.
If you track only one thing beyond revenue, make it contribution margin after advertising. It tells you whether growth makes you healthier or just busier.
Building the Per-Unit Fee Stack
The fee stack is the full list of costs between the shelf price and your profit. Sellers often count the product cost and the referral fee, then forget the rest.
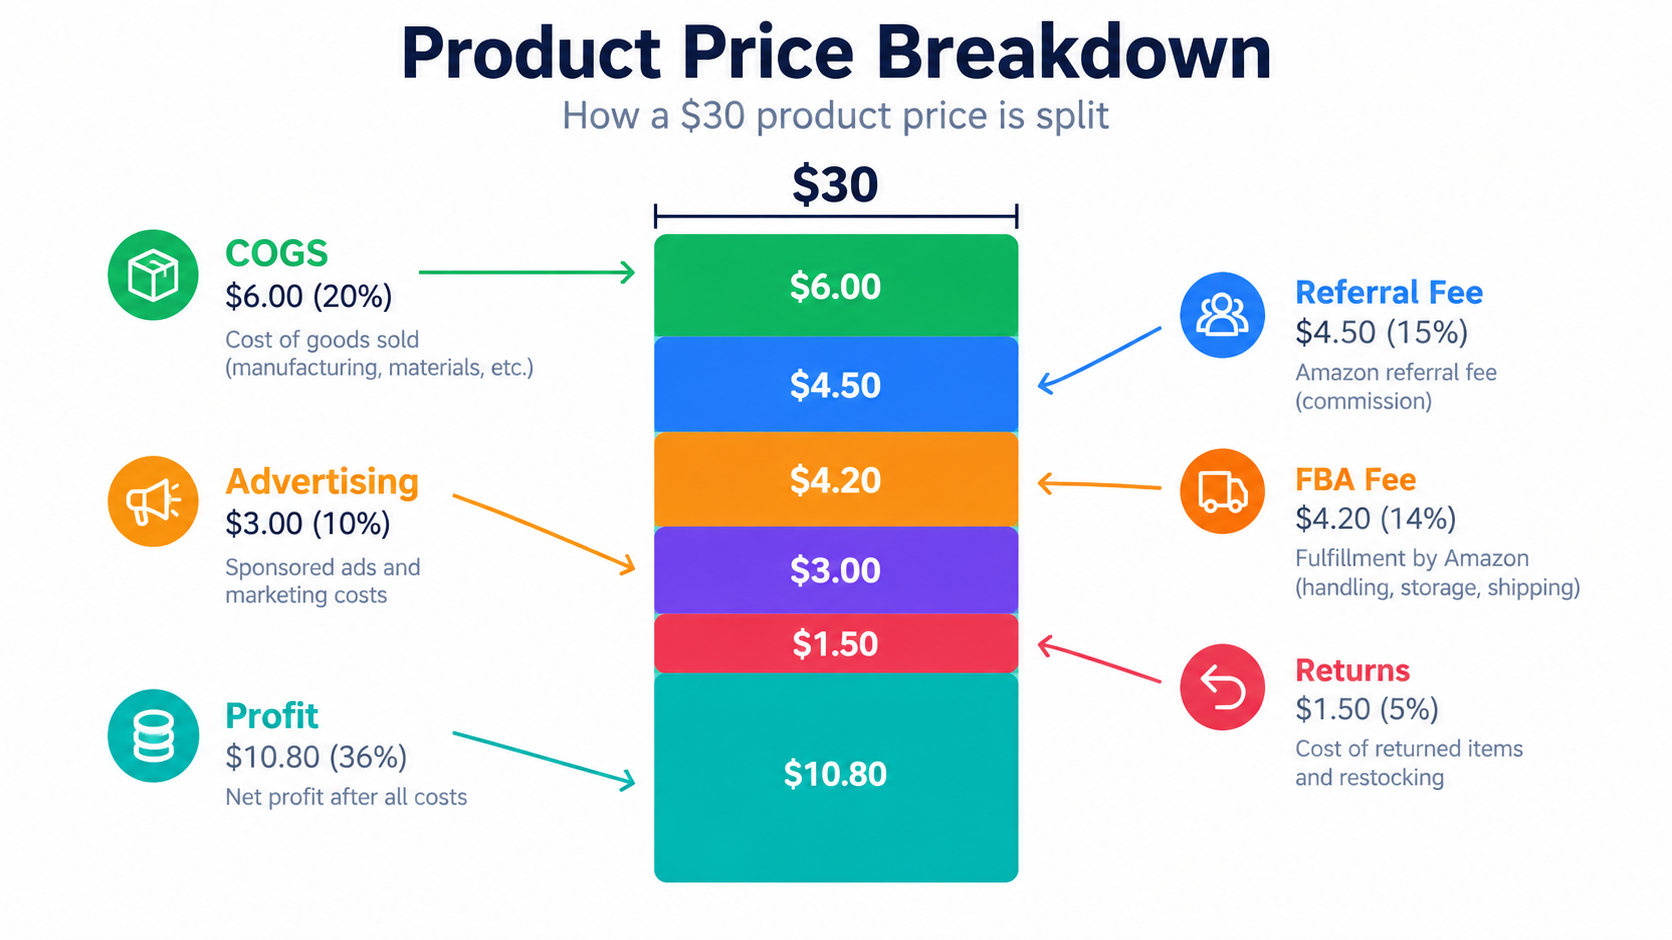
A hypothetical $30 product
Imagine a product that sells for $30. Here is one plausible breakdown, purely for illustration:
- Landed cost (manufacturing, freight, duties): $8.00
- Referral fee (assume 15%): $4.50
- FBA fulfillment fee: $5.50
- Inbound shipping and prep to Amazon: $0.60
- Storage fees, averaged per unit: $0.50
- Returns and unsellable units, averaged per unit: $1.20
- Advertising per unit: $4.00
Total costs: $24.30. Profit: $5.70 per unit, or 19% of price. Remove the returns and storage lines from your mental model, as many sellers do, and the same product looks like it earns $7.40. That is a 30% overstatement of profit.
Costs that hide in plain sight
- Long-term and aged inventory storage charges, which accumulate on slow sellers.
- Removal and disposal fees for stock you cannot sell.
- Currency conversion and payment platform fees if you pay suppliers abroad.
- Software subscriptions and listing tools, which are fixed but still must be covered.
- Coupons and promotions, which reduce realized price.
Build a spreadsheet with one row per SKU and one column per cost. Update it quarterly, since fee schedules change and your actual return rate drifts.
Break-Even ACoS vs. Target ACoS
Advertising cost of sales (ACoS) is the most quoted and most misunderstood number in Amazon PPC. A “good” ACoS does not exist in the abstract. It depends entirely on your margin.
Calculating break-even ACoS
Break-even ACoS equals your contribution margin before ads, divided by price. In the example above, margin before ads is $9.70 on a $30 price, so break-even ACoS is about 32%. Spend more than that on ads per sale and you lose money on every ad-driven order.
Target ACoS should sit well below break-even and depends on your goal. A launch might accept break-even or slightly worse. A mature product should run noticeably below it.
Why TACoS tells the better story
Total ACoS (TACoS) divides ad spend by total sales, including organic. It shows whether advertising is building organic momentum or simply renting every sale.
A falling TACoS while revenue holds steady suggests your organic rank is strengthening. A flat or rising TACoS means ads are doing all the work, and your margin is exposed to any rise in click costs.
The Two Phases of Ad Economics
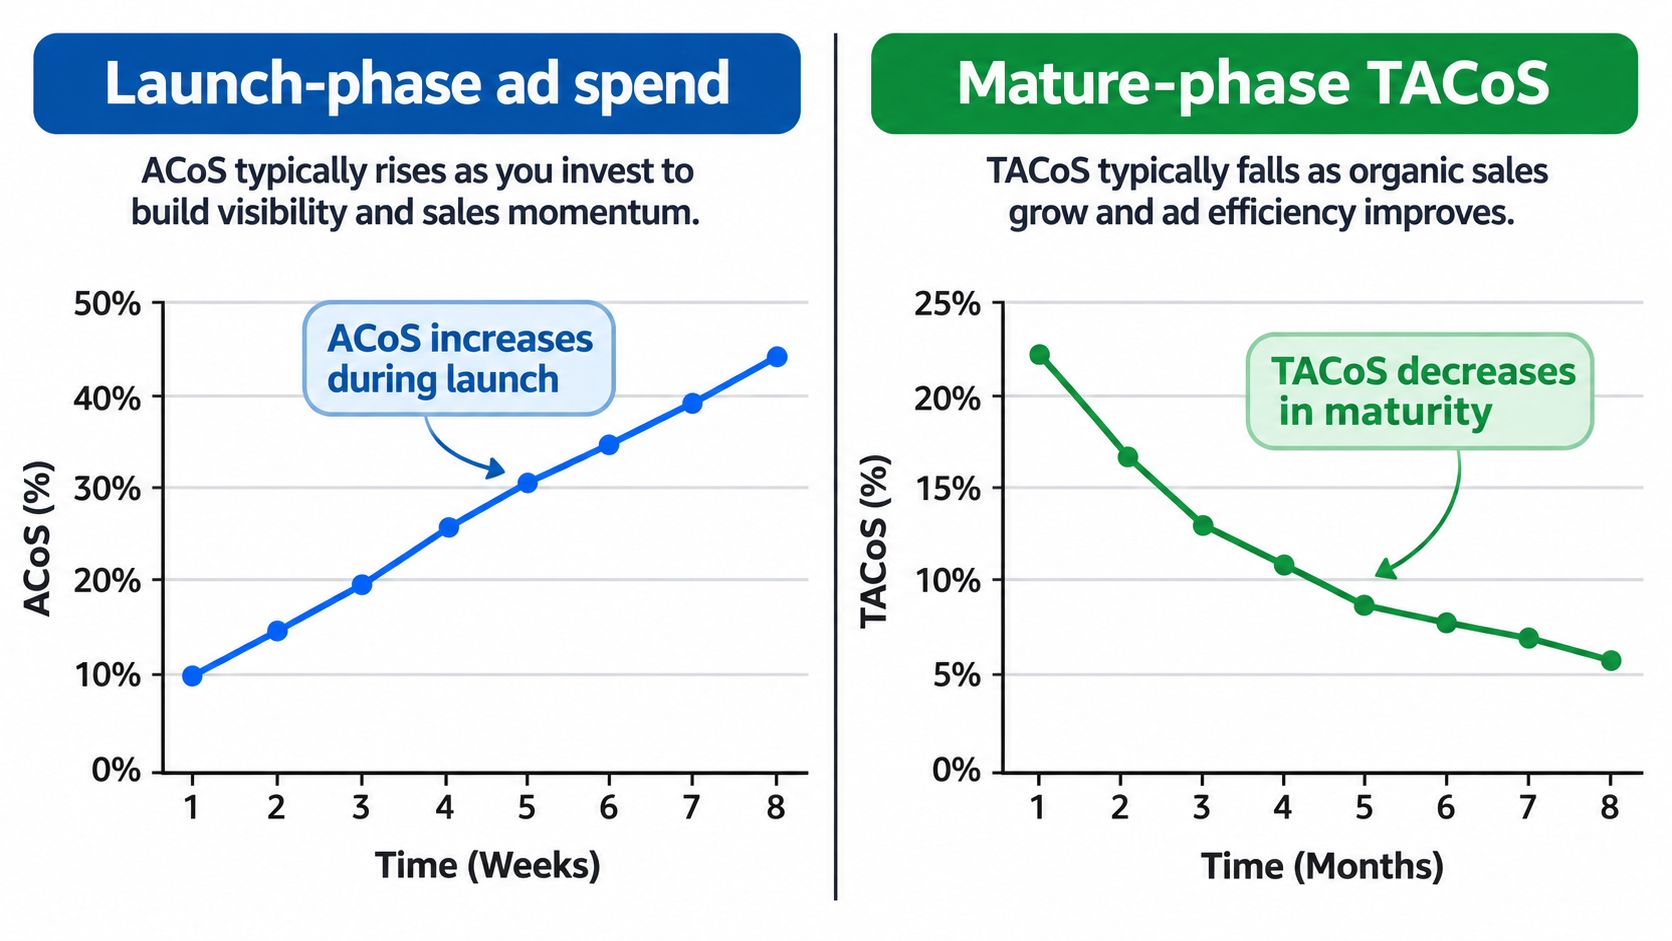
Advertising should not be managed with one target for a product’s whole life. There are at least two distinct phases, and mixing them up causes two opposite mistakes.
Launch phase: buying data and rank
New listings have no reviews, no sales history, and no organic placement. Ads buy visibility and the early sales that help the listing earn organic position. Running at a loss here can be rational, if you have set a budget cap and an exit condition.
Decide in advance: how much total loss will you tolerate, over how many weeks, and what TACoS marks success? Without those rules, a launch becomes an open-ended subsidy.
Mature phase: defending margin
Once a product has stable organic sales, ads should shift toward defending key terms, capturing high-converting keywords, and trimming waste. Look for search terms with many clicks and no orders, and cut or negate them.
The common mistake is staying in launch mode indefinitely. The opposite mistake is cutting ads so hard at maturity that rank slips. Move in steps and watch organic sales after each change.
The Cash Conversion Cycle: Where Growth Gets Strangled
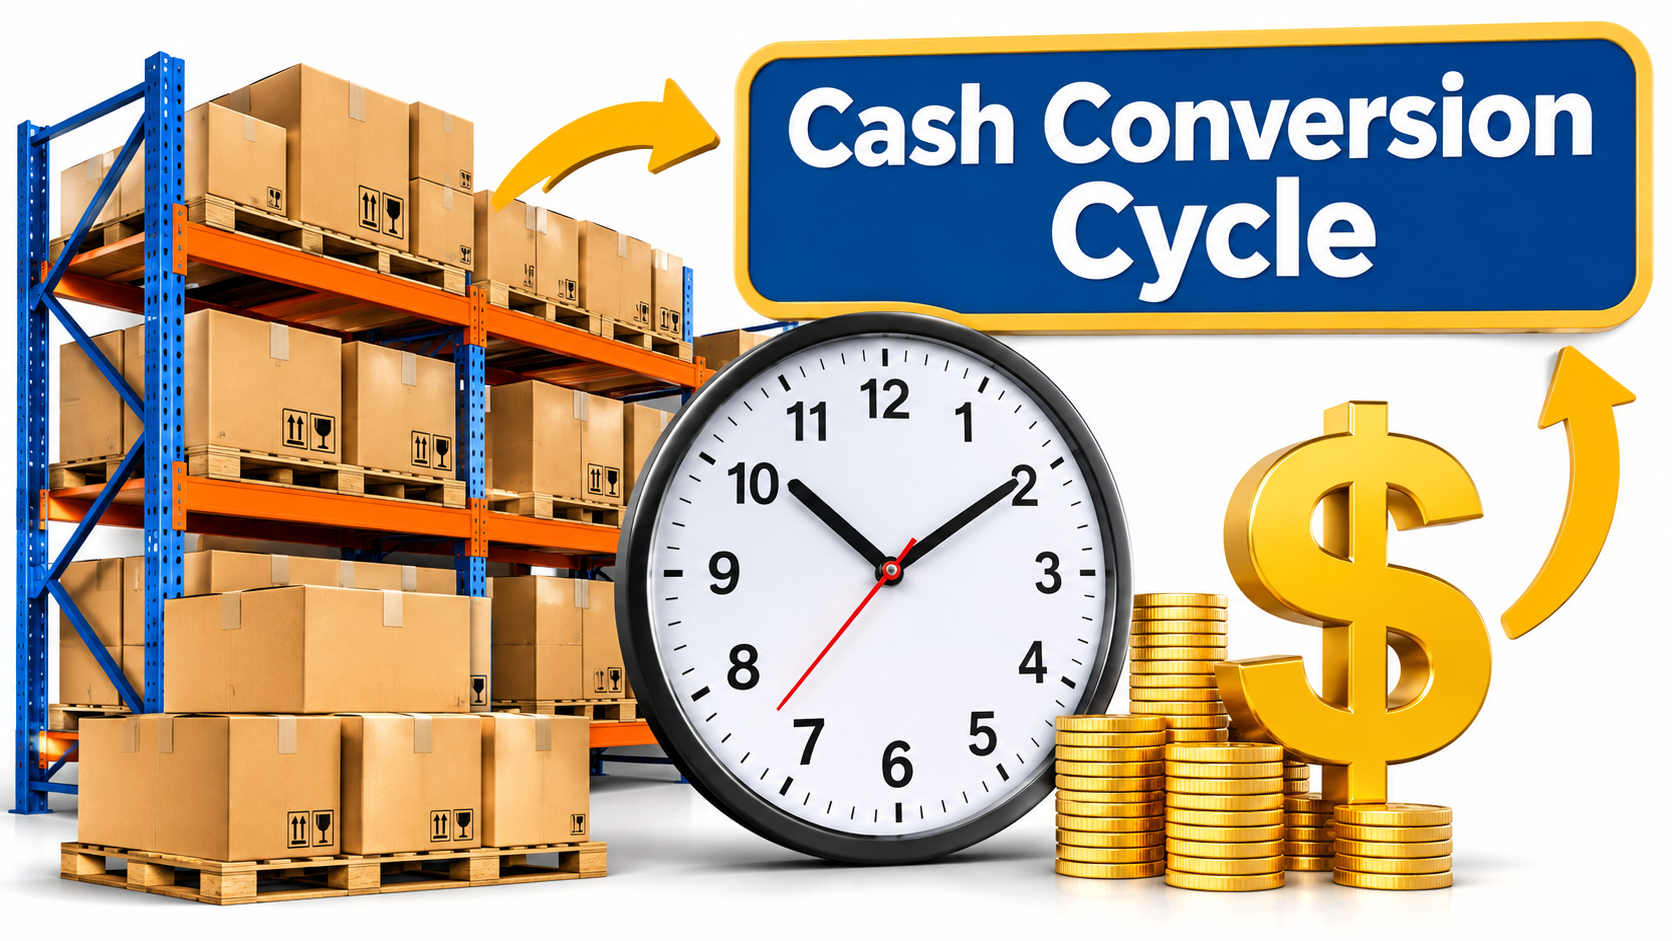
Physical product businesses pay first and get paid later. The gap can be long. You pay the manufacturer, wait for production, wait for shipping, wait for check-in at the fulfillment center, sell through the stock, and then wait for the payout.
Mapping your cycle
- Days from supplier deposit to production complete.
- Days in transit to the warehouse.
- Days from check-in to sell-through (average).
- Days from sale to payout.
Add them up. If the total is, say, 150 days, then every dollar you put into inventory is locked for about five months. A seller who doubles volume must fund twice the inventory before seeing any of the extra return.
Why fast growth can cause a cash crunch
Imagine a profitable product that sells out and needs a larger reorder. The supplier wants a deposit now. Payouts from current stock arrive over the coming weeks. The business is profitable on paper and short of cash in practice.
This is the reason many sellers stall. They are not out of ideas. They are out of working capital. Options include negotiating supplier terms, reducing production lead time, using smaller and more frequent orders, or using financing carefully, with a clear understanding of its cost against your margin.
Returns: The Cost You Only Notice in Aggregate
Returns hit twice: you may refund the sale and also lose the unit if it comes back unsellable. Rates differ hugely by category, with apparel and items where fit matters generally harder than simple consumables.
Reading the signals
- Check return reason reports for patterns, such as “item not as described” or “too small.”
- Read negative reviews for the same themes.
- Compare return rate across your own SKUs to find outliers.
Fixes that cost little
Many returns are expectation problems rather than product defects. Add a clear size chart, dimensions in an image, and a photo showing the item next to an everyday object for scale. Update bullets to state what is not included. Each fix reduces mismatch between listing and reality.
If a product has persistent quality complaints, no listing fix will hold. Raise it with the supplier, and consider an inspection before shipment.
Reorder Discipline: Stockouts vs. Overstock
Inventory has a cost in both directions. Stock out, and you lose sales and may lose rank. Overstock, and you pay storage, tie up cash, and risk markdowns.
A simple reorder formula
Reorder point = daily sales rate × (total lead time + safety buffer). If you sell 20 units a day and your end-to-end lead time is 70 days with a 14-day buffer, you should reorder when you have 1,680 units’ worth of coverage on the way or in stock.
The formula is only as good as the sales rate you feed it. Use a blend of recent velocity and seasonal expectations, and revisit it monthly.
Rank the SKUs by cash efficiency
If cash is limited, put it where each dollar earns the most. Divide expected profit per unit by landed cost per unit, then adjust for how fast it sells. A slower, higher-margin item can be a worse use of cash than a faster, thinner-margin one.
Listing Quality as a Margin Lever
Conversion rate affects profit directly. If a listing converts better, the same ad click produces more orders, lowering ad cost per sale. A modest conversion improvement can lift margin without touching price.
What to test
- Main image: the biggest driver of click-through from search results.
- Secondary images: use them to answer objections, show scale, and demonstrate use.
- Title and bullets: lead with what the buyer cares about, not internal jargon.
- Price: test small changes and measure net profit, not just units.
Use Amazon’s Manage Your Experiments tool, where eligible, so changes are measured rather than guessed. Run one change at a time and let tests collect enough traffic to be meaningful.
Concentration Risk: One ASIN, One Account, One Channel
Many seller businesses depend on a single hero product, one marketplace account, and one traffic source. That is efficient until it is not. An account issue, a listing suppression, a supplier delay, or a competitor undercutting can hit the whole business at once.
Practical ways to reduce exposure
- Track what share of profit (not revenue) comes from your top SKU.
- Develop a second and third product with different demand drivers.
- Keep documentation for invoices, supplier information, and compliance current, so you can respond quickly to Amazon requests.
- Build an owned channel, such as an email list, where policy allows.
- Qualify a backup supplier for your best seller.
None of these are glamorous. They are the kind of boring preparation that matters on the day something breaks.
A Monthly Operating Rhythm
Good operators tend to review the same few things on a schedule. Here is a practical cadence.
Weekly
- Check inventory coverage against reorder points.
- Review ad search terms; negate waste and promote winners.
- Scan for new negative reviews and customer questions.
Monthly
- Recalculate contribution margin per SKU with actual fees.
- Compare TACoS trend to the previous month.
- Review return reasons and storage charges.
Quarterly
- Cut or liquidate chronic slow movers before storage charges compound.
- Re-check the fee schedule and policy updates.
- Decide where next quarter’s inventory cash goes.
A 30-Day Action Plan
- Week 1: Build the per-unit fee stack for your top five SKUs, using real figures from your reports.
- Week 2: Calculate break-even and target ACoS for each. Flag campaigns above break-even that are not part of a deliberate launch.
- Week 3: Map your cash conversion cycle and compute reorder points. Identify any SKU at risk of stockout or overstock.
- Week 4: Fix the highest-return-rate listing, start one controlled listing test, and name a second product or supplier to reduce concentration risk.
Conclusion
Amazon selling rewards the seller who understands the arithmetic beneath the dashboard. Rank and reviews matter, but they are inputs. The outputs that determine survival are margin per unit and cash on hand.
Start with an honest fee stack. Set ad targets from break-even, not from folklore. Measure how long your money is locked in stock, and reorder with a formula instead of a feeling. Then protect the business from single points of failure.
Do that, and growth becomes something you can fund and control, rather than something that happens to you.