


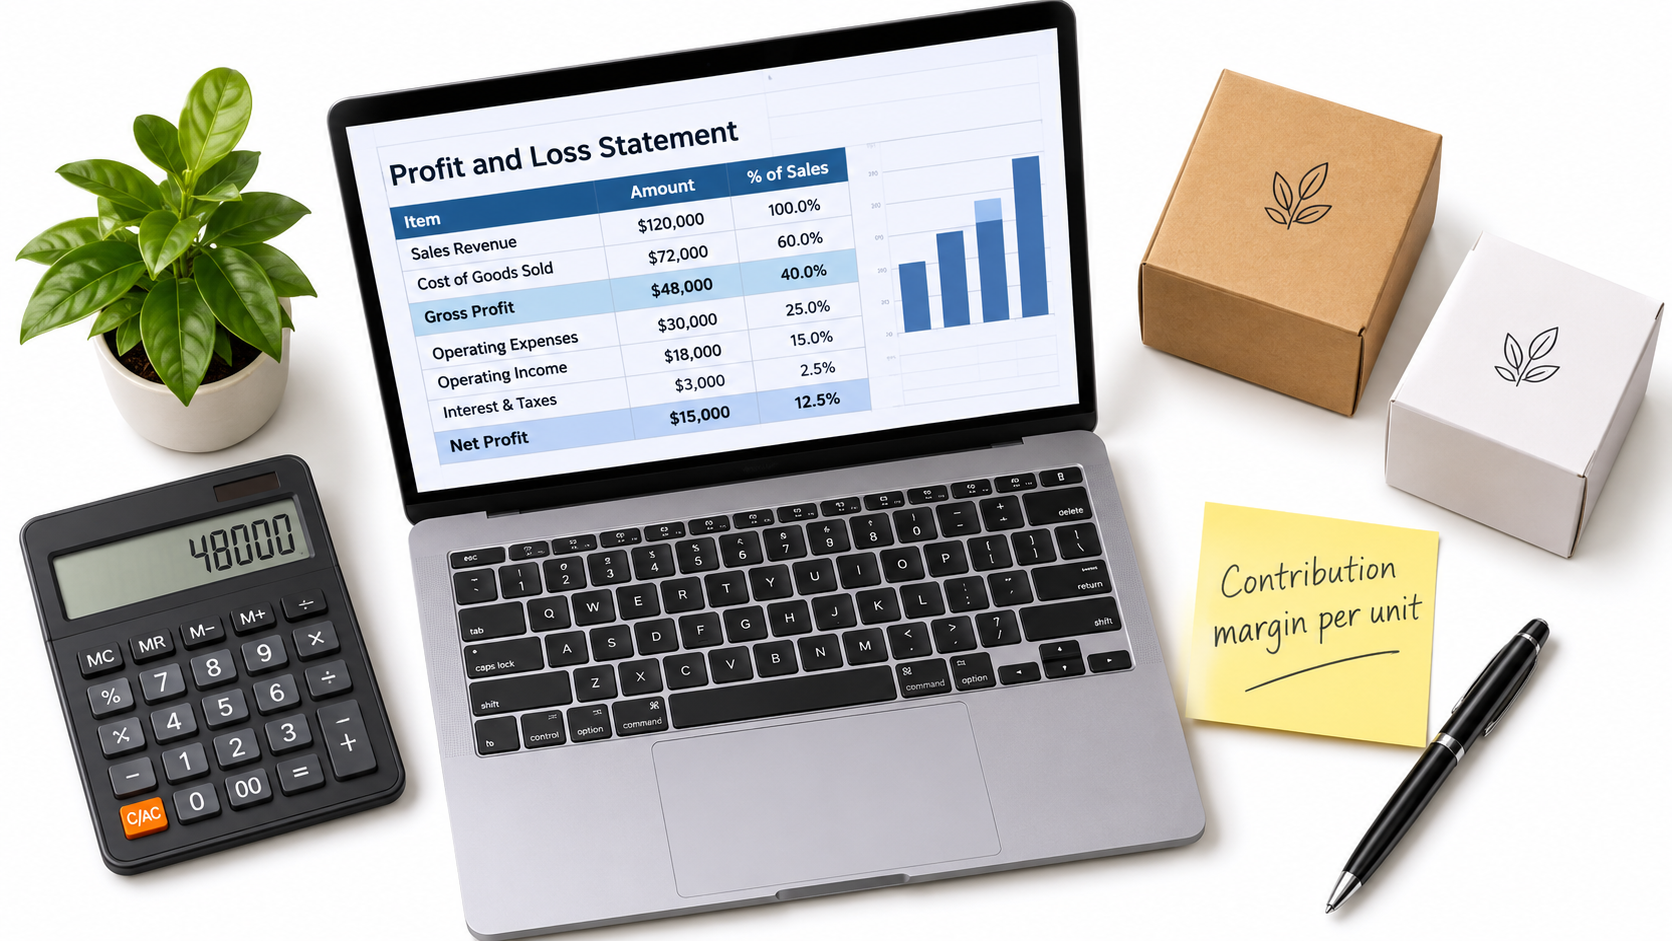

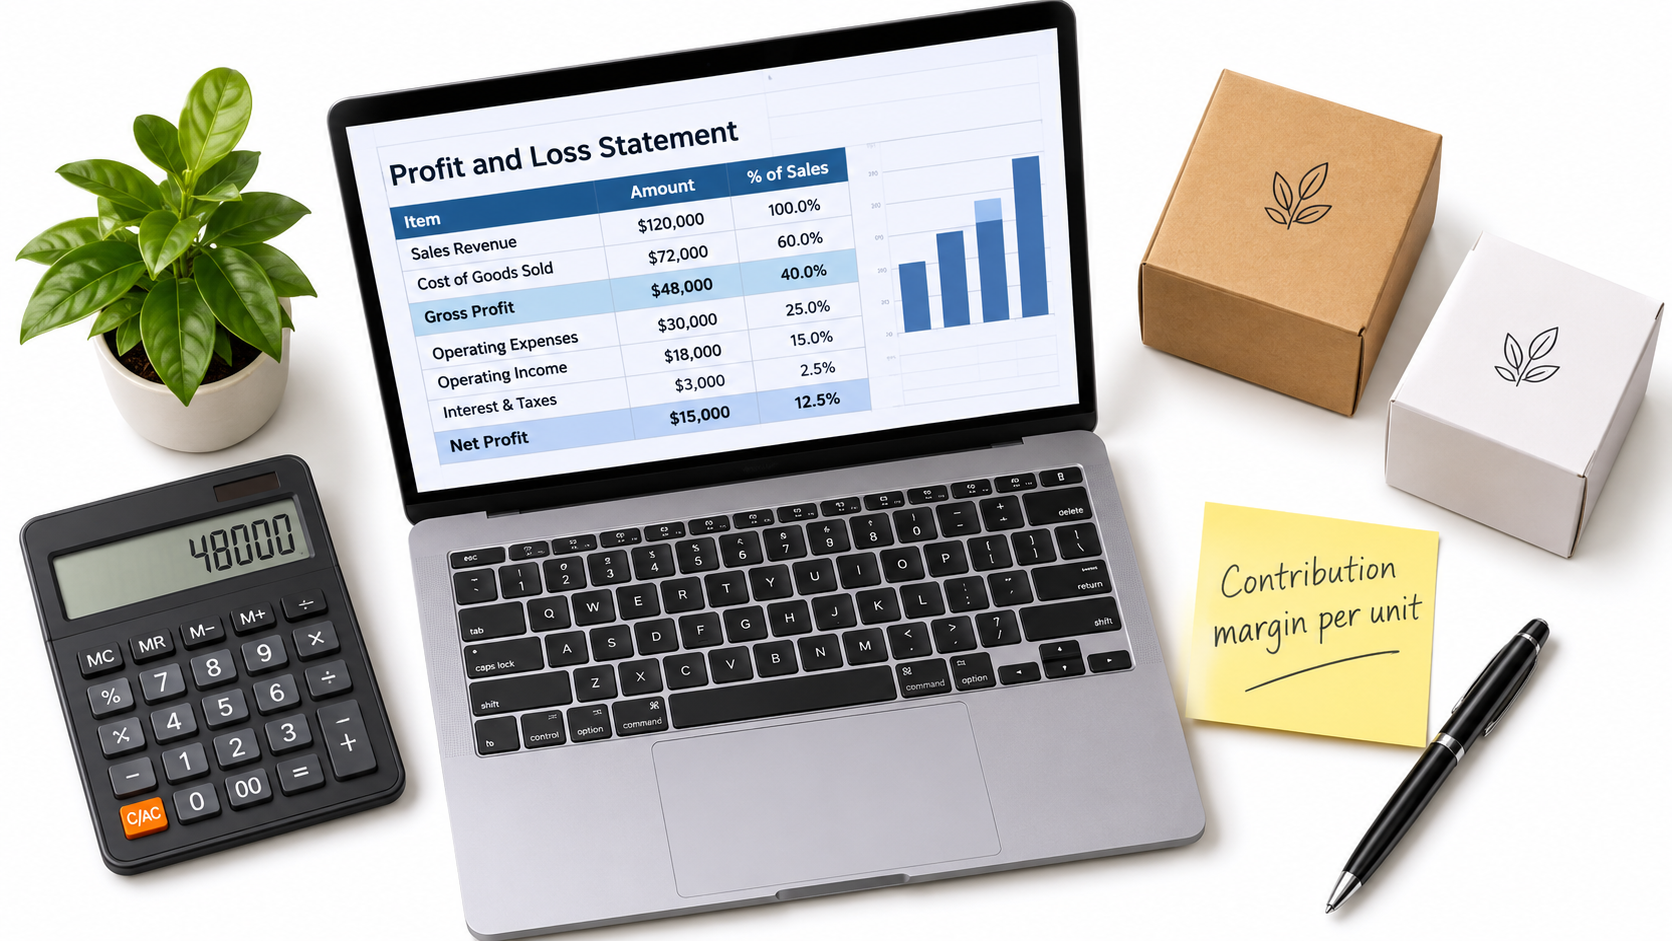
Ask ten Amazon sellers how their business is doing and most will answer with a revenue number. Ask what they kept last quarter, and the answers get vague. That gap between sales and retained profit is where most Amazon businesses quietly struggle.
This post is about closing that gap. It does not cover listing tricks or ranking algorithms. It covers the accounting view of Amazon selling: a per-unit P&L, the cash that sits in inventory, and the decisions that follow once you can see both.
A note on numbers: Amazon’s fee schedules change often and vary by category, size tier and region. This article uses round, hypothetical figures to show the method. Check Seller Central’s current fee schedule before applying any of it to your catalog.
Why Revenue Is the Wrong Scoreboard
Amazon’s dashboard puts sales front and center. It is easy to read, it moves daily, and it feels like progress. But sales is the top line of a long subtraction.
Between the customer’s payment and your bank account sit referral fees, fulfillment fees, storage, advertising, returns, inbound shipping, and the cost of the goods themselves. Each can be small alone. Together they often take most of the sale price.
The growth trap
When margins are thin, growth can make things worse. More units mean more ad spend to hold rank, more inventory to buy upfront, and more returns to absorb. A seller doing twice the revenue can end up with less cash than before.
The fix is not to grow slower. It is to know your margin per unit before you scale a product.
Building a Per-Unit P&L
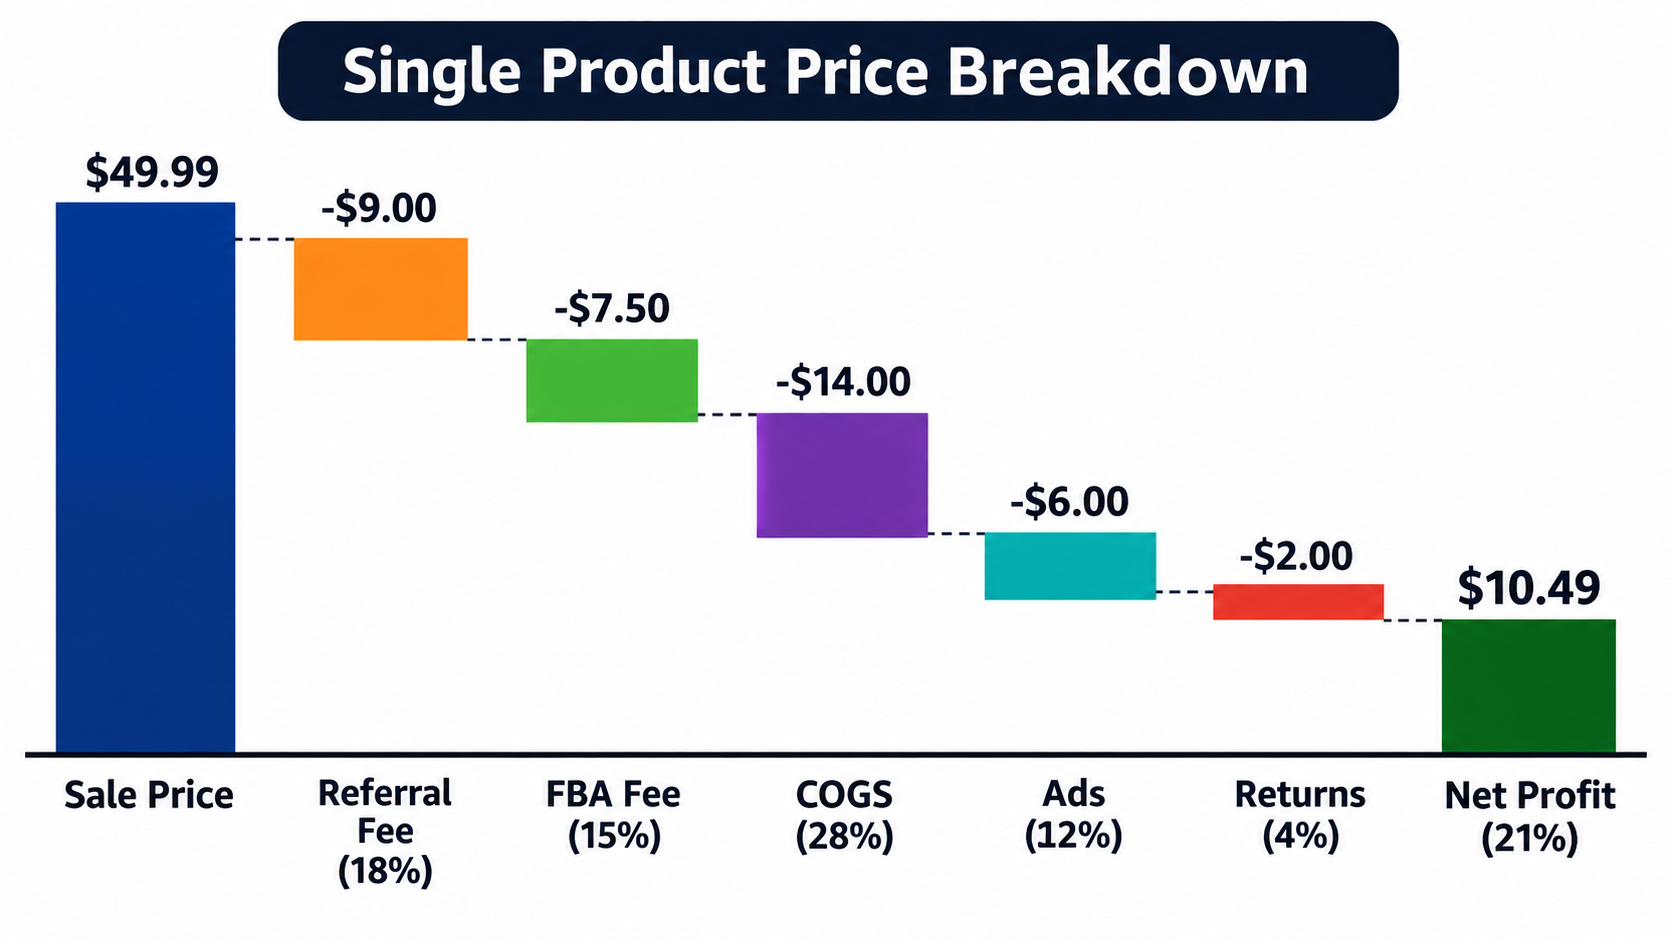
Start with one ASIN. Write down every cost that attaches to a single unit sold, then subtract from the average selling price.
The line items
- Average selling price: net of coupons and promotions, not list price.
- Referral fee: the category percentage on the sale price.
- Fulfillment fee: based on size and weight tier if you use FBA.
- Storage and inbound costs: monthly storage, placement charges and freight, spread per unit.
- Cost of goods: landed cost, including duties, freight, packaging and inspection.
- Advertising: total ad spend divided by total units, not just ad-attributed units.
- Returns and damages: refunded revenue plus unsellable inventory.
- Overhead share: software, accounting, and your own time if you want honesty.
A hypothetical example
Say a product sells for $30. Referral fee takes $4.50, fulfillment $5.50, landed cost $9, advertising $4, storage and inbound $1, and returns $1. That leaves $5 per unit, about 17% of price.
It looks healthy until a fee rises by a dollar or ad costs climb. Then margin drops by a fifth. Knowing which line is most sensitive tells you where to defend.
Contribution Margin vs. Net Margin
Two margin numbers matter, and they answer different questions.
Contribution margin is what each unit earns after variable costs. It tells you whether a product is worth selling at all. Net margin subtracts fixed overhead and tells you whether the business is worth running.
Which one to use for decisions
Use contribution margin to compare ASINs and decide ad budgets. Use net margin to judge the company overall. Mixing them up leads to keeping unprofitable products because they “cover overhead,” or cutting good ones because overhead feels heavy.
Advertising: Total ACoS vs. the Number You See
Seller Central reports ACoS for ad-attributed sales. That number is useful but incomplete, because it ignores organic sales and ad spend’s effect on them.
TACoS as a sanity check
Total advertising cost of sale divides ad spend by all revenue, organic included. A falling TACoS with stable sales suggests ads are building organic rank. A rising TACoS with flat sales suggests you are paying more to stand still.
Break-even ACoS
Your break-even ACoS equals your margin before ad spend, as a percentage of price. In the example above, margin before ads is $9 on $30, or 30%. Any campaign with ACoS above 30% loses money on that sale, unless you have a deliberate launch plan to buy rank.
If you run launch campaigns at a loss, set a budget and an end date. Open-ended losses are not a strategy.
Returns: The Cost That Hides in Plain Sight
Returns hit twice. You refund the customer, and the returned unit may not return to sellable stock. Some categories, especially apparel and anything with sizing or fit issues, carry much heavier return rates than others.
Reading your return reasons
Download the returns report and group reasons. Patterns usually point to fixable causes: listing images that mislead, a size chart that is off, or a quality defect from one production batch. Fixing the root cause is often the cheapest margin gain available.
Inventory Is a Cash Decision

A profitable product can still starve you of cash. You pay the manufacturer weeks or months before Amazon pays you. Every unit in transit or sitting in a warehouse is cash you cannot spend elsewhere.
The cash conversion cycle
Count the days from paying your supplier to receiving the disbursement from Amazon. Include production, shipping, receiving, selling time and Amazon’s payout delay. A cycle of 120 days means a year’s worth of growth requires financing roughly a third of annual cost of goods at any time.
Days of cover
Track how many days of sales your stock covers. Too little risks stockouts and lost rank. Too much raises storage fees and ties up cash. Pick a target per product based on lead time and demand variability, and review it monthly.
Slow Sellers and Aged Inventory
Every catalog has laggards. Keeping them is rarely free, because storage fees accrue and Amazon may add surcharges on aged stock.
A simple decision rule
For each slow ASIN, compare the cost of holding another 90 days against the recovery from liquidating now. If a price cut, bundle or removal order yields more cash than waiting, act. Cash recovered from dead stock funds your best sellers.
Sensitivity Testing: What Breaks Your Margin
Once your per-unit sheet exists, stress it. Change one input at a time and see what happens.
- Raise landed cost 10% to reflect tariffs or freight spikes.
- Raise fulfillment fees by a dollar.
- Increase advertising cost per unit by 20%.
- Raise return rate by a few points.
- Drop selling price 5% to meet a competitor.
Products that stay profitable across most scenarios are your core. Products that go negative with one small change are fragile and should not get more inventory.
Where to Put the Next Dollar
With contribution margin, break-even ACoS and cash cycle per ASIN, allocation becomes simpler. Rank products by margin per unit multiplied by unit velocity, then adjust for cash tied up.
A practical ranking
- Scale: high margin, steady sales, healthy review profile.
- Fix: good demand but weak margin; renegotiate cost, adjust price or cut returns.
- Harvest: mature, stable; reduce ads and collect cash.
- Exit: low margin, slow sales; liquidate.
A Monthly Review Routine
Numbers only help if you look at them. A 60-minute monthly routine is enough for most small sellers.
- Reconcile Amazon’s settlement reports against your accounting software.
- Update per-unit costs for each ASIN with actual fees charged.
- Review ACoS, TACoS and break-even by campaign.
- Check return reasons and flag recurring issues.
- Review days of cover and plan reorders.
- Assign each ASIN to Scale, Fix, Harvest or Exit.
Conclusion: Takeaways
Amazon selling rewards sellers who treat it as a unit-economics business rather than a sales contest. Revenue shows activity. Margin and cash show health.
- Build a per-unit P&L for every ASIN using actual fees.
- Know your break-even ACoS and set launch spend limits.
- Use TACoS to judge whether ads build organic sales.
- Treat returns as a diagnosable cost, not a fixed one.
- Track cash conversion cycle and days of cover.
- Stress-test margins and invest only in resilient products.
Start with your top five ASINs this week. The results will likely change where you spend next month.