
There is a version of TikTok Shop product research that most sellers know intimately. It goes something like this: you open the app on a Tuesday afternoon, scroll the For You Page for twenty minutes, bookmark three videos of products you vaguely find interesting, and then spend the next two days agonizing over whether any of them are worth sourcing. By Friday, you are either paralyzed or you have placed a test order on something that has already peaked. Either way, you have lost the week.
This is not a workflow. It is a habit dressed up as research.
The sellers who consistently find winning products on TikTok Shop in 2026 are not more intuitive than you. They are not plugged into secret communities or running more ad spend. What they have — and what most sellers lack — is a repeatable, time-bounded, systematic process for separating real demand signals from entertainment noise. They run the same scan every week. They ask the same questions in the same order. They score what they find against the same criteria. And when the answer is “no,” they say no fast and move on.
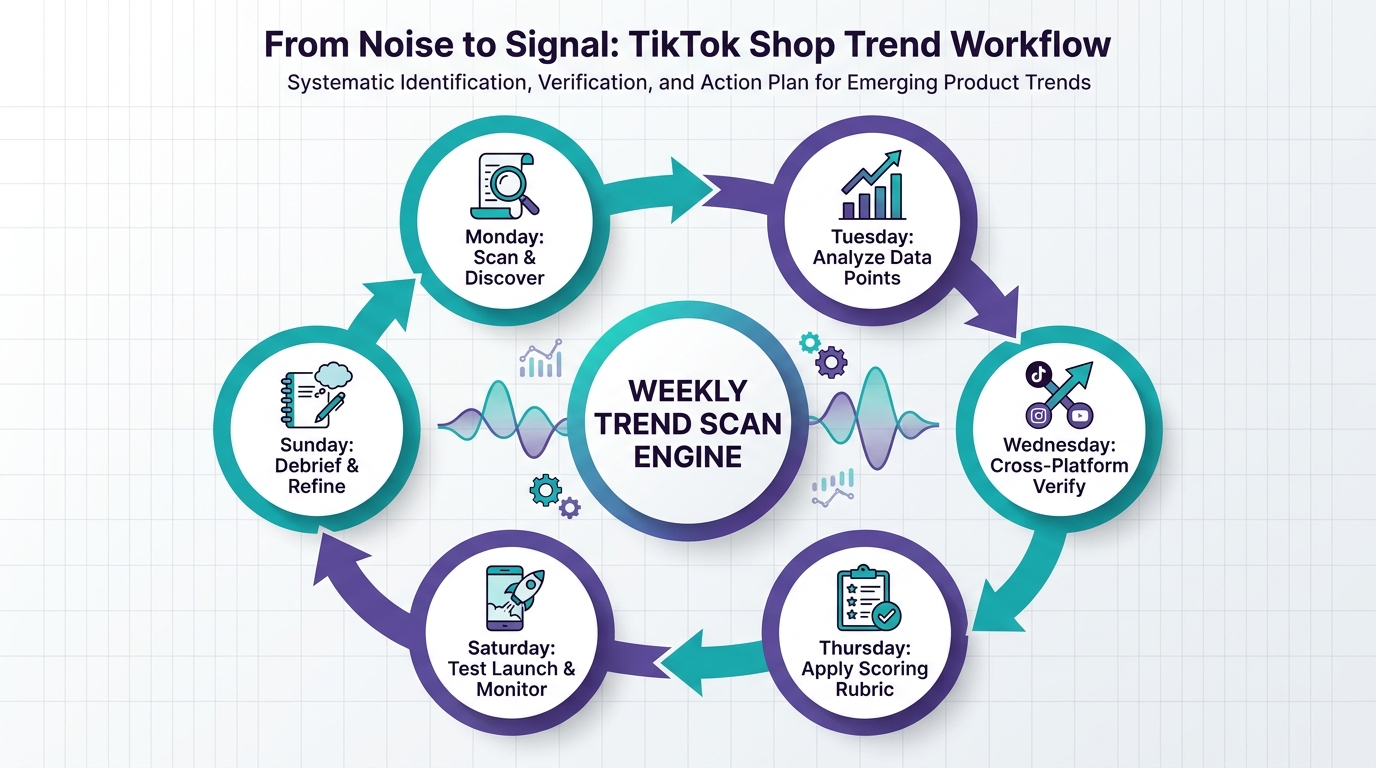
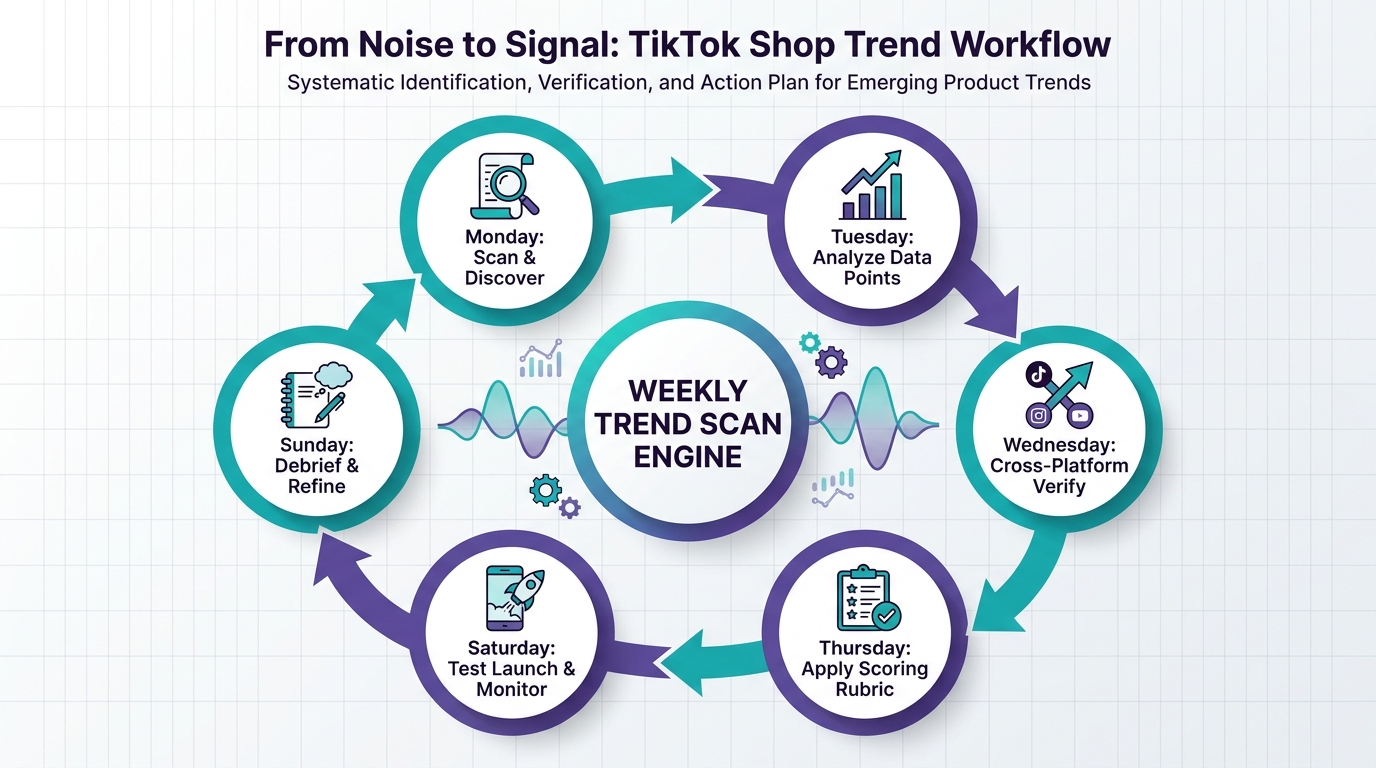
This post is the blueprint for that system. Not a loosely described “framework,” but an actual weekly workflow: what you do Monday morning, what you check midweek, what your cross-platform validation looks like, how you score a candidate before committing inventory, and how you debrief on Friday so your next scan is smarter than the last one. We will cover the tools, the data signals, the saturation traps, and the scoring rubric — everything you need to turn trend scanning from a time-sucking guessing game into a structured competitive advantage.
Why Most TikTok Shop Trend Research Fails Before It Starts
Before building a better system, it is worth understanding precisely why the default approach fails. The problem is not a lack of data. TikTok Shop sellers in 2026 have access to more trend data than any e-commerce platform in history. The Creative Center, the Opportunity Center, the Seller Center, third-party analytics suites — the raw material is everywhere. The failure is almost always structural: sellers are solving the wrong problem at the wrong time with the wrong signal.
The Recency Bias Problem
When sellers open their TikTok feeds looking for product ideas, they are consuming content that the algorithm has already amplified. By the time a product video is dominating your For You Page, it has typically been in active circulation for at least 48 hours. On TikTok Shop, that is often the difference between opportunity and saturation. Research from practitioners tracking micro-trend windows consistently finds that the commercially viable phase of a product trend — the window where early sellers see strong conversion and manageable competition — frequently collapses within 72 hours of a breakout signal.
A seller who relies on their feed to discover trends is, structurally, always late. The For You Page is a lagging indicator.
The Virality ≠ Demand Confusion
The second failure mode is conflating entertainment virality with buying intent. A video racking up 3 million views of a product demo does not mean 3 million people want to purchase that product. TikTok’s algorithm rewards watch time, replays, and shares — behaviors that may have nothing to do with purchase motivation. A satisfying oddly-satisfying cleaning product video can accumulate enormous view counts from people who will never add anything to a cart.
Sellers who treat view counts as a proxy for demand consistently over-invest in products that convert poorly. The metric that actually matters is transactional engagement: comment sentiment that reflects buying intent (“where do I buy this?”, “just ordered mine”), add-to-cart rates where visible, GMV growth in Seller Center analytics, and click-through rates on shoppable video posts.
The Single-Source Dependency
A third common failure is building an entire research process around one data source — usually the TikTok Creative Center’s Top Products list. While that list is genuinely useful, it reports on what has already been trending, not what is beginning to trend. Sellers who only consult it are selecting from a set of opportunities that have, by definition, already been discovered by others. A robust trend scan triangulates across multiple signal sources, each of which sees a different slice of the demand picture.
The Missing Decision Framework
Finally, most informal research processes have no scoring layer. Sellers consume trend data, develop a gut feeling, and either act or do not act. Without explicit scoring criteria — margin thresholds, saturation limits, cross-platform confirmation requirements — every decision is a fresh negotiation with your own cognitive biases. A structured workflow eliminates that negotiation. The criteria exist before you start looking, so the data tells you what to do rather than your enthusiasm overriding what the data says.
Understanding the TikTok Shop Trend Lifecycle
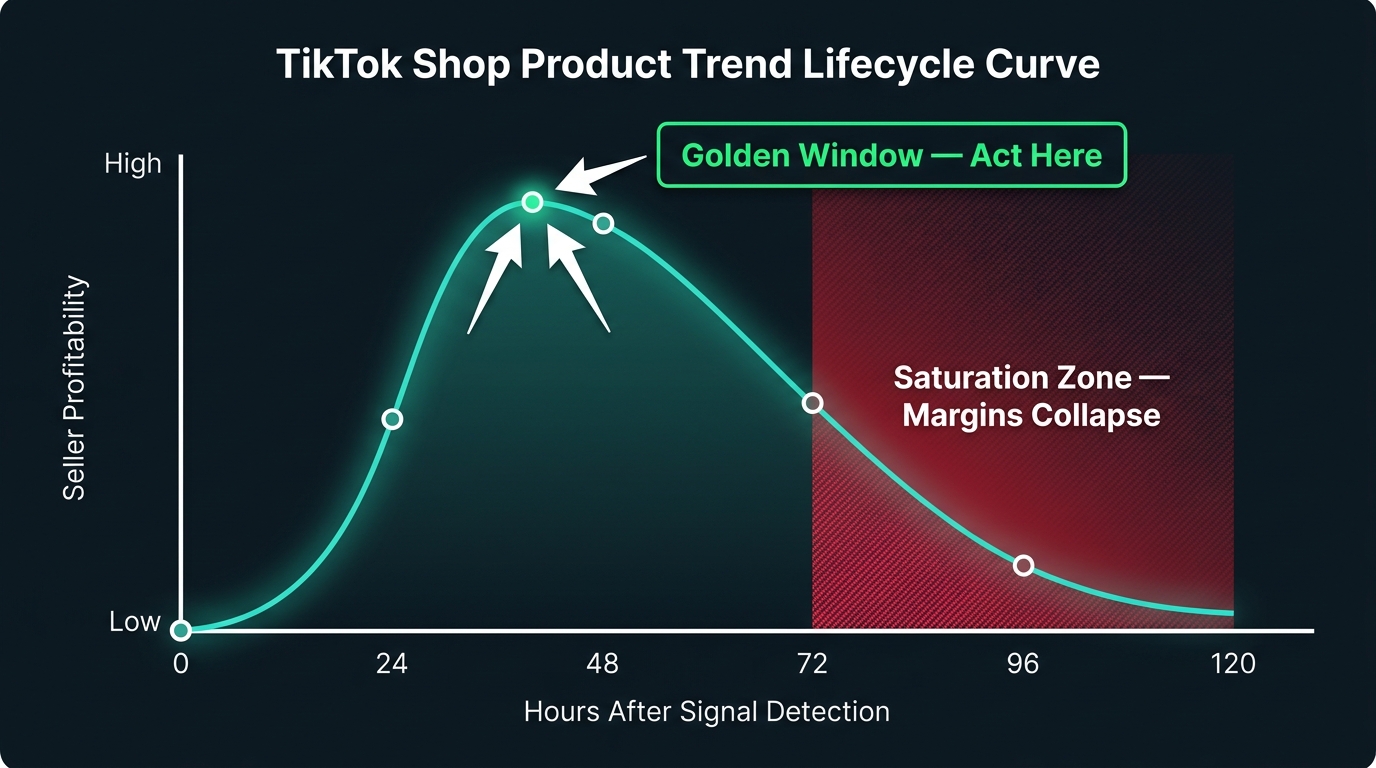
To build a workflow that is timed correctly, you need a working model of how TikTok Shop trends actually move. The lifecycle is compressed compared to traditional e-commerce. Understanding each phase changes what you should be scanning for and when.
Phase 1: Pre-Breakout (Hours 0–12)
This is the hardest phase to detect reliably, but it is where the best opportunities live. A product or content format is beginning to get traction with a small cluster of creators — often micro or mid-tier creators in a specific niche, not mega-influencers. View counts are modest, but the engagement-to-view ratio is unusually high. Comments are specific and intent-driven. Search volume on the product term is starting to tick upward but is not yet registering on most trending product lists.
Catching trends in this phase requires monitoring tools with fast data refresh rates, active community participation in niche creator networks, and a habit of watching pattern breaks — products appearing repeatedly in your feed from unrelated creator accounts in a short window.
Phase 2: The Golden Window (Hours 12–48)
This is the financially attractive phase. The product has enough validated demand to justify action, but has not yet been piled into by hundreds of competing sellers. Creator adoption is spreading organically. Search volume is rising consistently. Early GMV numbers in Seller Center are moving in the right direction. A seller who detects the signal in this phase, has inventory available or a reliable sourcing shortcut, and can produce content quickly will find favorable conversion rates and a relatively clear competitive field.
The entire point of a weekly workflow is to systematically find yourself in Phase 2 as often as possible, rather than stumbling into it occasionally by luck.
Phase 3: Breakout and Saturation (Hours 48–120)
This is the phase most sellers are operating in when they think they are acting on a trend. The product is now widely visible. Top Products lists are featuring it. Multiple large creators have posted. The category is flooded with competing listings. Conversion rates are falling as buyer attention is split across dozens of identical offerings. Paid amplification is required to stand out, which erodes margins. For most sellers, this is not an opportunity — it is a crowded commodity fight.
Sellers who enter here are not trend scanners. They are trend followers, and the economics rarely work in their favor.
Phase 4: Tail and Decay (Days 5–14+)
Some products transition from micro-trend to sustained category performer. These are the genuine exceptions — typically products that solve a persistent problem rather than riding a content format. Most micro-trends decay quickly after Phase 3. Saturation continues, prices erode, and without new content angles, the algorithm deprioritizes the product. Sellers who entered in Phase 2 often exit here with strong margins. Sellers who entered in Phase 3 are often still holding inventory they cannot move profitably.
Understanding this lifecycle is not just background knowledge. It directly determines the cadence of your weekly workflow. You are not trying to scan everything — you are trying to reliably find Phase 1 and Phase 2 signals before your competitors do.
The Three Signal Layers You Need to Scan
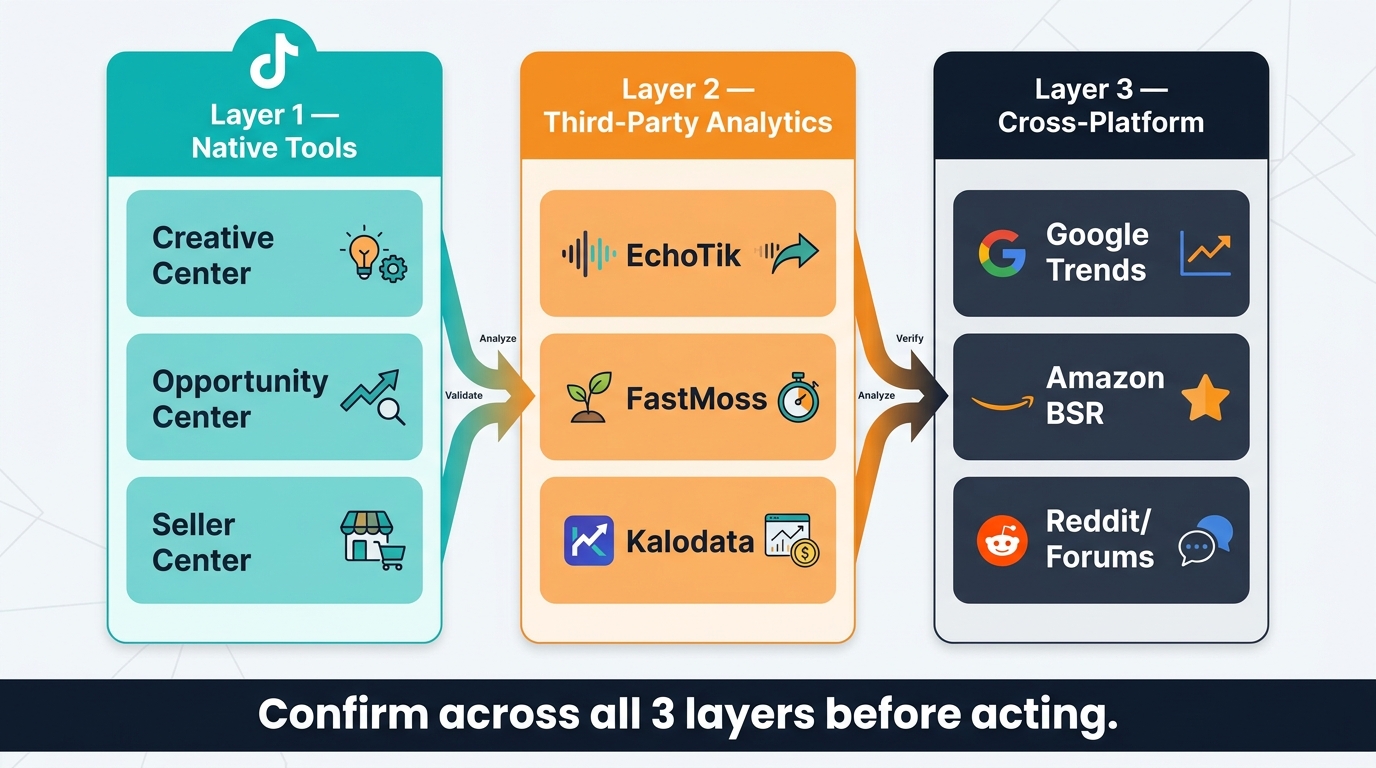
No single data source gives you a complete picture of whether a trend is real, timely, and commercially viable. A robust scan uses three distinct signal layers, each of which answers a different question. Using all three in sequence transforms trend evaluation from a gut-feel exercise into a structured process.
Layer 1: Native TikTok Tools (What Is Moving on the Platform Right Now?)
TikTok’s own data infrastructure gives you the most current, platform-specific signals available. The relevant native tools are the Creative Center, the Seller Center, and the Opportunity Center.
TikTok Creative Center is your primary discovery surface. Navigate to Trending Products (under Inspiration), filter by your target country and category, and sort by growth rate rather than raw volume. A product showing 400% growth in the last seven days with modest total volume is far more interesting than the top-ranked product in your category that has been there for three weeks. Also use the Trending Hashtags and Trending Keywords sections — rising hashtag velocity often precedes product trend breakouts by 12–24 hours.
TikTok Seller Center surfaces your own product data, but its broader analytical views — particularly category performance benchmarks and traffic source breakdowns — tell you whether a trend is being driven by organic discovery (higher confidence) or paid amplification (lower confidence, harder to sustain).
TikTok Opportunity Center is the most underused native tool. It surfaces product and niche opportunities based on TikTok’s internal signals of unmet demand — categories where search volume and engagement are growing but supply-side content is thin. Note that Opportunity Center data typically runs on a T-1 to T-2 delay, meaning what you see today reflects behavior from the last 24–48 hours. Factor this lag into your timing decisions.
Layer 2: Third-Party Analytics (Is the Signal Real and How Saturated Is the Category?)
Third-party tools like EchoTik, FastMoss, and Kalodata give you analytical dimensions that TikTok’s native tools do not: historical trend comparison, creator adoption patterns, GMV estimates across multiple sellers, and saturation indicators. They are your verification layer. A product that looks promising in the Creative Center gets tested against third-party data to assess whether it is genuinely early-stage or already oversupplied.
The key metrics to pull from third-party tools: the number of active sellers in the product category over the last seven days (is it growing exponentially, suggesting a rush?), the diversity of creators posting about the product (organic spread across many small creators is a stronger signal than concentration in a few large accounts), and GMV trend lines — you want to see early, consistent growth rather than a single spike and plateau.
Layer 3: Cross-Platform Validation (Is This a TikTok Bubble or Real Demand?)
The final signal layer confirms whether TikTok buzz reflects actual consumer demand or a platform-specific content moment that will not translate to sustained sales. Google Trends and Amazon BSR (Best Seller Rank) movements are the two most reliable external validators.
If a product is genuinely breaking into consumer consciousness, you will typically see Google Trends search volume beginning to tick upward within 48–72 hours of the TikTok signal. If Google Trends is flat while TikTok is going wild, you may be looking at a content trend — something people find entertaining — rather than a buying trend. Amazon BSR gives you a demand-side cross-check: a rising BSR rank in the relevant category confirms that purchase intent exists across channels, not just on TikTok.
Monday: Setting Up Your Hypothesis Block
The most important discipline in a weekly trend scan is the one that happens before you open a single tool. Every Monday morning, before any research begins, you define the narrow parameters of what you are looking for this week. This is your hypothesis block.
Why Hypotheses Come Before Data
The volume of TikTok Shop data is overwhelming if you approach it without constraints. Without a starting hypothesis, you will spend your scanning time context-switching between unrelated categories, chasing whatever catches your eye, and ending up with a disorganized list of vague possibilities that are hard to prioritize or act on. Effective trend scanners use the hypothesis block to filter ruthlessly before looking at anything.
A well-formed hypothesis looks like this: “This week I am scanning for home organization products under $35 targeting small apartment dwellers.” Or: “I am looking for beauty tool accessories in the $20–$50 range that have emerged in the last two weeks.” Or: “I want to find men’s grooming products gaining traction with creators who post in the fitness niche.” Specific, bounded, actionable.
How to Form Good Hypotheses
Good hypotheses come from four sources. First, your existing category knowledge — what niches do you already source in, and what adjacent categories have you been watching? Second, macro consumer interest shifts — what categories are growing in the broader market, based on quarterly retail data or platform-wide trend reports? Third, seasonal and calendar signals — what buyer needs become acute in the next 30–60 days? Fourth, your own sales data — which of your current products showed unusual velocity last week, suggesting a related trend may be breaking nearby?
Write down two to three hypotheses. No more. The constraint forces prioritization and makes your subsequent scanning session far more efficient. A Monday hypothesis block should take no more than fifteen minutes.
Defining Your Scoring Thresholds Upfront
Also on Monday, before you touch any research tools, record your go/no-go thresholds for the week. These typically include your minimum acceptable margin percentage, the maximum number of active competing sellers you will tolerate before calling a category saturated, and the minimum cross-platform confirmation requirements (e.g., “Google Trends must show at least +20% search growth in the last 30 days”). Setting these thresholds before you see any data eliminates the bias that comes from falling in love with a product before you have checked the economics.
Midweek Deep Dive: Reading the Opportunity Center and Seller Center Data
Tuesday and Wednesday are your primary data-gathering days. With your Monday hypotheses in hand, you now run a structured scan across your native tools, using the Opportunity Center and Seller Center as your primary data sources for this phase.
Working the Opportunity Center Effectively
The Opportunity Center is designed to surface demand gaps — product categories where consumer interest is growing faster than the supply of content and sellers to meet it. Use it with your hypotheses as filters. If your hypothesis is about home organization products, navigate to that category in the Opportunity Center and sort by the fastest-growing demand signals, not the largest absolute volume.
Three things to look for in the Opportunity Center. First, categories or product types showing search growth with below-average content density — this is TikTok’s internal signal of unmet demand. Second, rising keywords in your category that you have not seen before — new vocabulary appearing in search often precedes product breakouts. Third, any product category that appears in both the Opportunity Center and the Trending Products section of the Creative Center simultaneously — double-signal products are higher-confidence candidates.
Remember the T-2 data delay. The Opportunity Center’s boosted impression data reflects behavior from 48 hours ago. For very fast-moving trends, this means the window may have already advanced significantly by the time you see the signal. Use it to confirm trends that are already showing early signs in your feed, not as a standalone discovery tool.
What Seller Center Analytics Actually Tell You
If you already have products listed, Seller Center analytics give you a different kind of signal: category-level performance benchmarks that reveal whether a trend is lifting your own products. An unusual spike in impressions or click-through rate on an existing product — without any corresponding increase in your own marketing activity — often indicates that the category is getting platform-wide attention. This is a valuable early alert that a related trend may be breaking nearby.
Also use Seller Center to monitor the traffic source breakdown for your category. A shift toward higher organic discovery traffic (videos, For You Page, search) relative to paid traffic suggests the algorithm is actively distributing content in that category, which is typically a positive indicator for organic trend discovery.
Setting Up Your Midweek Shortlist
By end of Wednesday, you should have a shortlist of three to five product candidates that have cleared your native-tool scan. Each should be documented with: the product or category name, the specific signals that flagged it (which tool, which metric, approximate numbers), the estimated age of the trend (how long has it been showing movement?), and an initial saturation assessment (how many sellers and creators are already active?).
Do not act on any of these yet. The midweek shortlist is input for your cross-platform validation step, not a decision list.
Spotting the Saturation Trap: False Positives Before You Buy Inventory
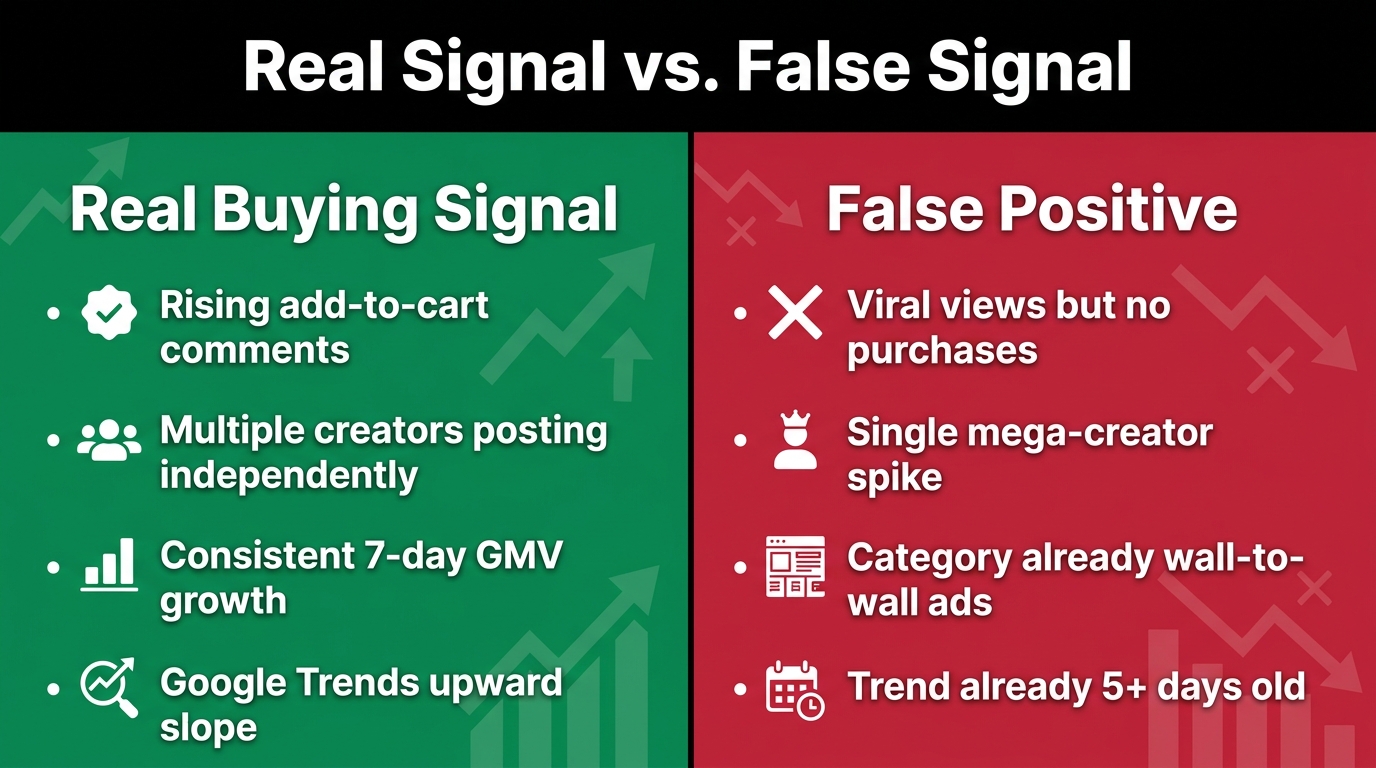
Of all the skills in TikTok Shop product research, none is more valuable — or more underappreciated — than the ability to discard false positives quickly. A false positive is a product that looks like an opportunity but is not: a trend that has already peaked, a viral product with no real purchase intent, a category that appears to be growing but is actually just getting louder. Spotting false positives before you commit inventory is the difference between a workflow that generates profit and one that generates lessons.
The Single-Creator Spike
One of the most common false positives is the single-creator spike. A mega-influencer or well-known creator posts a product video that gets 10 million views. The product appears to go “viral.” But the demand is concentrated in one content event, not distributed across the creator ecosystem. When you check the creator diversity in your analytics tools, you find one or two accounts driving all the activity, with no meaningful organic spread to smaller creators.
Trends driven by a single large creator rarely generate sustained commercial opportunity. The creator’s audience watches and moves on. There is no ongoing wave of content reinforcing the product in discovery feeds. The product spikes and collapses within 48 hours. The lesson: always check creator concentration before adding a product to your shortlist. Healthy trends show activity spreading from multiple independent creators, typically with a mix of content formats and audience demographics.
The View-Without-Intent Pattern
A product video accumulating millions of views is not a buying signal. TikTok viewers consume enormous amounts of content passionately without any purchase intention. The categories where this creates the most false positives tend to be “satisfying” product demonstrations (oddly-satisfying cleaning, cooking gadgets, aesthetic organization) and novelty items (unusual designs, unexpected physical features).
The signals that distinguish genuine purchase intent from entertainment engagement are specific. Look for: comment sections with explicit buying language (“what’s this called?”, “link in bio?”, “just ordered mine”), high ratios of saves and shares relative to views (saved content is intended for future reference, including potential purchase), and verified GMV movement in your analytics tools. Entertainment virality and buying intent can coexist — but they often do not, and treating them as equivalent is costly.
The Ad Wall Signal
One of the clearest saturation indicators is what practitioners call the “ad wall.” When you search for a product term on TikTok or in the Seller Center and encounter a high density of paid promotional content, the product category has already been identified as valuable by enough sellers that they are paying to compete for visibility. This is a late-stage saturation signal. The sellers running those ads had the same insight you are having, but earlier. The organic opportunity is largely exhausted.
The ad wall is not a signal to act — it is a signal to move on. Flag the category in your research log as a reference point for future scans (to understand what late-stage saturation looks like in that vertical), and return your attention to earlier-stage signals in your shortlist.
The Trend Age Problem
Every product on your midweek shortlist should be assessed for trend age — how many days has it been showing measurable movement? Given that the commercially viable window for most micro-trends is 24–72 hours, a product that has been trending for five days by the time you discover it is a very different proposition from one you are seeing at the 24-hour mark.
Use your third-party analytics tools to plot the GMV or engagement trend line over the last seven days. A product that hit a sharp peak on Day 2 and has been declining since is not an opportunity regardless of its absolute numbers. A product with a consistent upward slope over four to five days may be transitioning from micro-trend to sustained category winner — a different kind of opportunity that requires different stock and marketing commitments.
Thursday: Cross-Platform Confirmation
With your shortlist filtered down and false positives removed, Thursday is your cross-platform confirmation day. You are not looking for more TikTok data here. You are stepping outside the platform to validate whether TikTok’s signals reflect real consumer demand or platform-specific noise.
Google Trends as a Demand Reality Check
Google Trends is the most accessible cross-platform validator. Search the product name or category term, filter to your target region, and look at the last 30-day and 90-day trend lines. What you are looking for is not a dramatic spike — dramatic spikes in Google Trends often represent news events or one-off curiosity, not sustained purchase demand. You want a gradual, consistent upward slope that began within the last one to three weeks, suggesting that TikTok-driven awareness is converting to broader consumer search behavior.
Flat Google Trends while TikTok numbers are high is not automatically disqualifying, but it is a yellow flag. It can mean the product is in very early stages before broader search activation, or it can mean the TikTok traction is entertainment-driven and not converting to cross-platform demand. Context matters: a product with a very niche audience (specialty fitness equipment, professional tools) may generate real commercial demand without significantly moving Google’s broad search volume.
Amazon BSR as a Purchase Intent Validator
Amazon BSR movement is your most reliable cross-platform purchase intent signal. A product that is genuinely breaking into consumer demand will typically show accelerating Amazon BSR movement in its category within 48–72 hours of TikTok traction. Sellers who monitor BSR on their shortlisted products as part of the Thursday validation step consistently report it as one of the highest-signal data points in the entire workflow.
To use BSR effectively as a validation tool: identify the closest Amazon product match for each shortlisted item, note the current BSR, and check the historical BSR trend using an Amazon tracking tool like Keepa. A product whose BSR has improved (numerically decreased) by 30% or more in the last seven days is experiencing genuine purchase demand acceleration. A product with a stable or worsening BSR despite TikTok noise is a strong false-positive candidate.
Reddit and Community Forums as Sentiment Filters
For certain categories — health and wellness, tech accessories, home improvement, pet products — community forum sentiment provides a valuable additional validation layer. A quick search on Reddit, relevant Facebook Groups, or niche forums tells you whether the product is being discussed organically by real consumers, not just promoted by brand accounts and affiliates.
Organic community discussion, particularly where real users are recommending a product to others based on personal experience, is a strong long-tail demand signal. It suggests the product has genuine utility that will sustain interest beyond the initial TikTok content moment. Absence of any community discussion is not disqualifying, but its presence is a meaningful confidence booster.
The 5-Point Viability Score: Making the Go/No-Go Decision
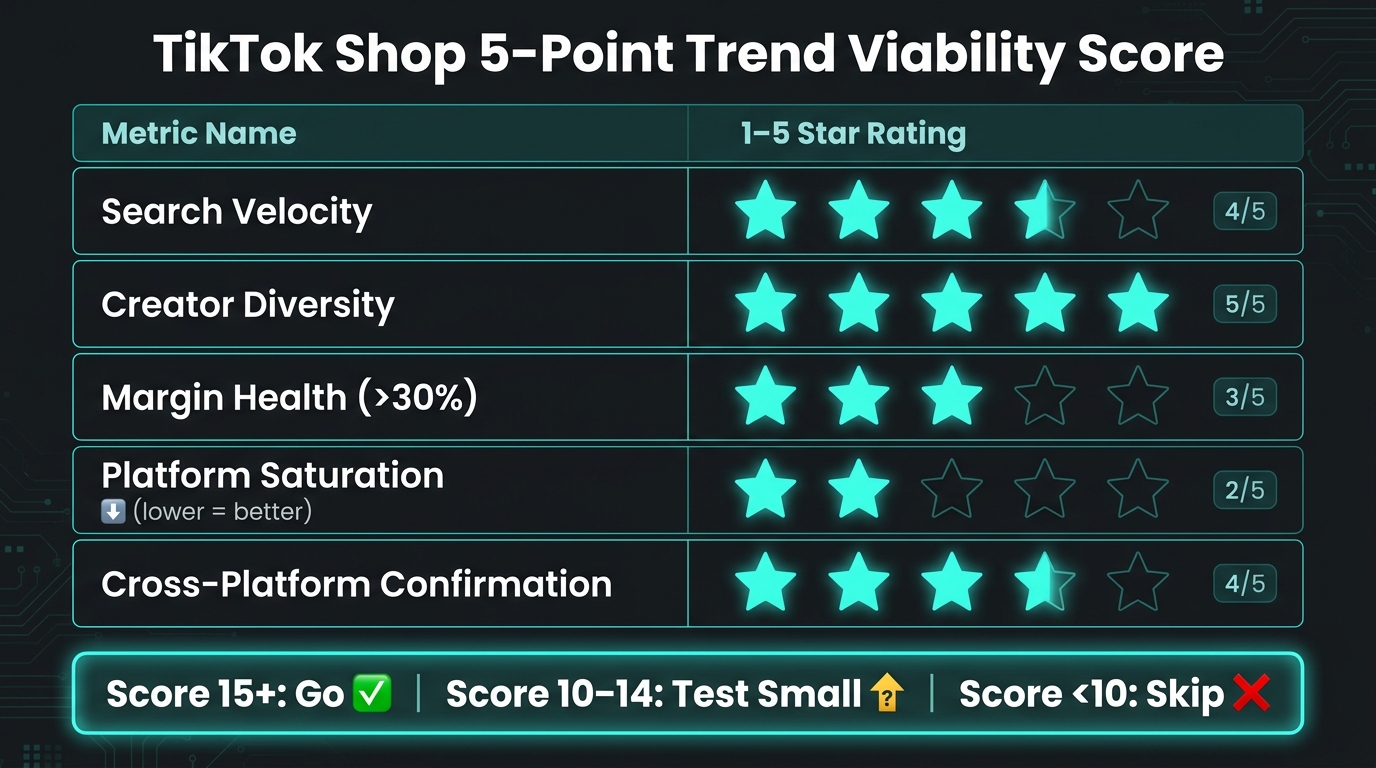
After your cross-platform validation, every remaining shortlisted product gets scored on a five-point viability framework before any sourcing, content creation, or listing work begins. This scoring step is where the workflow converts from research into decisions.
Dimension 1: Search Velocity (1–5)
Score the product’s search volume growth rate over the last seven days. A 300% or greater week-over-week growth rate in TikTok search earns a 5. A 100–300% growth rate earns a 3–4. A growth rate below 100% or a flat trend earns a 1–2. This dimension rewards early signals over established trends. A product that everyone has already found scores lower than an emerging one showing the same growth potential.
Dimension 2: Creator Diversity (1–5)
Score based on how many independent creators are producing content about the product in the last seven days, and how varied their audience demographics and content styles are. Ten or more independent creators across multiple niches earns a 5. Three to nine diverse creators earns a 3–4. Fewer than three creators, or heavy concentration in one large account, earns a 1–2. Creator diversity is one of the most reliable leading indicators of sustained trend momentum — more creators means more ongoing content fuel for the algorithm to distribute.
Dimension 3: Margin Health (1–5)
Score based on your calculated landed margin at current competitive pricing. This dimension requires actual supplier research, not estimates. A margin above 40% earns a 5. A 30–40% margin earns a 3–4. A margin below 30% — or one that drops below 30% once you account for TikTok Shop seller fees (currently ranging from 5–8% depending on category), shipping, returns, and any affiliate commission — earns a 1–2. This is a hard gate dimension. No product should proceed to sourcing with a margin score of 1, regardless of its scores on other dimensions.
Dimension 4: Saturation Index (1–5, lower score = more saturated)
This dimension is inversely scored. A product with fewer than 50 active competing sellers in the category in the last seven days earns a 5. Fifty to 150 active sellers earns a 3–4. More than 150 active sellers, or clear evidence of a paid ad wall, earns a 1–2. This dimension directly measures your ability to stand out and capture meaningful market share. High competition is not always a dealbreaker — but combined with a weak margin score, it is almost always a decision to pass.
Dimension 5: Cross-Platform Confirmation (1–5)
Score based on whether your Thursday validation produced positive signals outside TikTok. Both Google Trends and Amazon BSR showing positive movement earns a 5. One of the two showing positive movement earns a 3. Neither showing positive movement earns a 1–2. As noted earlier, absence of cross-platform confirmation is a yellow flag rather than automatic disqualification — but it should lower your confidence and your order quantity if you decide to proceed.
Interpreting the Score
Total scores run from 5 to 25. Use these thresholds as your decision guide:
- 20–25: Strong go. Prioritize this product, move on sourcing and content creation immediately.
- 14–19: Conditional go. Proceed with a small test order and limited content investment. Do not commit full inventory until the test returns data.
- 8–13: Hold and monitor. Check again in 48 hours. If score has not improved, deprioritize.
- 5–7: Pass. Document the product in your research log for future reference, but do not invest time or capital at this stage.
This scoring system is not infallible. No quantitative framework can eliminate the uncertainty inherent in predicting consumer behavior. What it does is eliminate the worst decisions — the enthusiasm-driven, data-light commitments that drain seller margins — and focus your limited time and capital on the highest-conviction opportunities your scan has surfaced.
The Third-Party Tool Stack: EchoTik, FastMoss, and Kalodata Explained
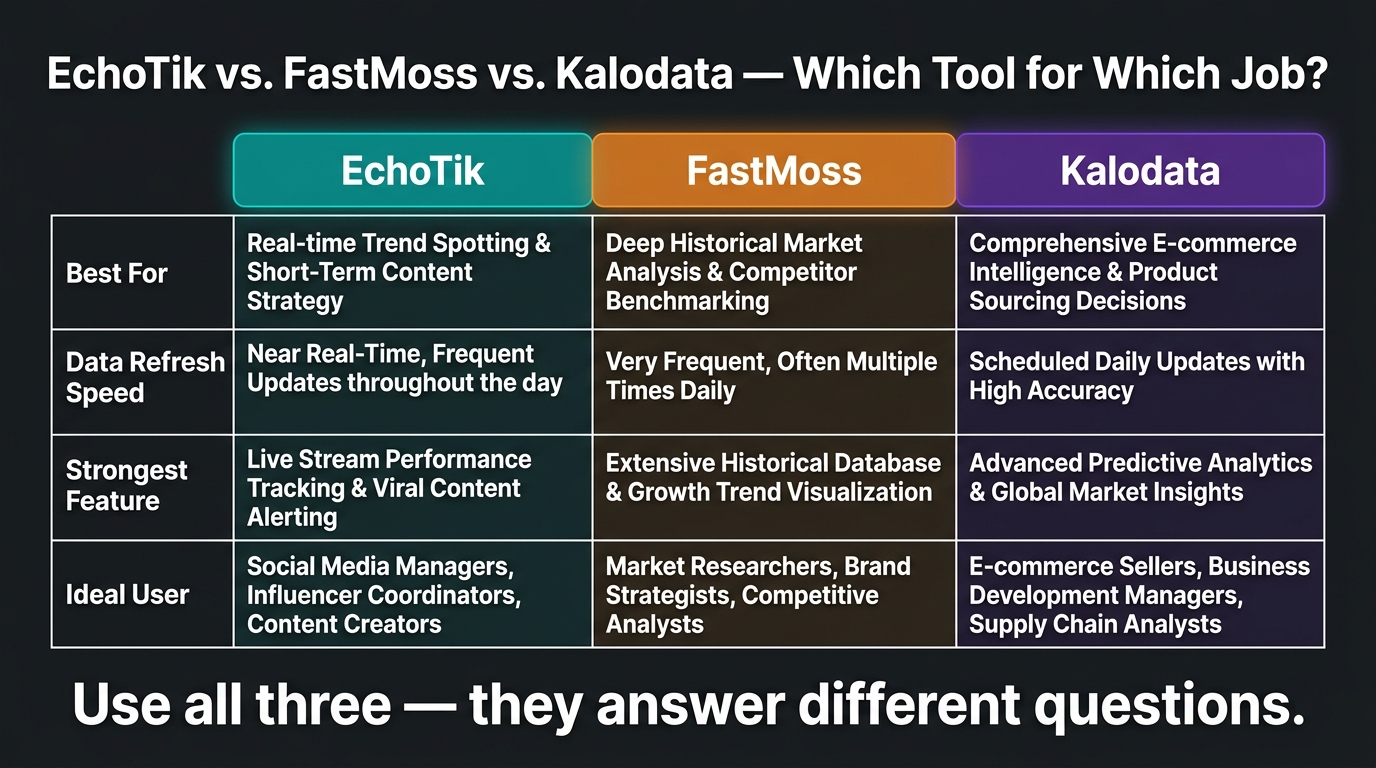
Third-party analytics tools are essential to the Layer 2 scan, but they are not interchangeable. EchoTik, FastMoss, and Kalodata have meaningfully different strengths, data architectures, and ideal use cases within a weekly workflow. Using the wrong tool for the wrong question produces unreliable results. Understanding what each does best lets you allocate your tool time precisely.
EchoTik: Full-Funnel Shop Intelligence
EchoTik is the most comprehensive TikTok Shop-specific intelligence platform currently available. Its primary strength is connecting the dots across the full TikTok Shop ecosystem: products, creators, shops, live streams, and market trends in a single interface. For weekly trend scanning, EchoTik is most valuable for two specific use cases.
First, live-stream trend monitoring. Live commerce is increasingly driving TikTok Shop GMV, and EchoTik’s live-stream analytics give you visibility into which products are moving significant GMV through live sessions, which is often a leading indicator of broader product trend breakouts. A product that multiple creators are pushing hard in live shows often precedes the same product appearing in organic short-form content trends by 12–24 hours.
Second, creator-to-GMV attribution. EchoTik’s creator intelligence layer lets you assess which creators are genuinely driving sales versus which are generating views without commercial outcomes. For the Creator Diversity dimension of your viability score, EchoTik provides the most reliable data on whether a trend is being driven by commercially effective creators or by high-reach-low-conversion accounts.
FastMoss: Global Trend Hunting and Speed
FastMoss is optimized for breadth and speed. It covers multiple TikTok markets simultaneously and updates trending product and creator data more frequently than most competitors. For weekly trend scanning, FastMoss is most valuable in the early discovery phase — particularly for sellers who operate across more than one regional market or who want to identify trends breaking in one geography before they migrate to another.
The classic FastMoss use case is the cross-regional early warning: a product trending in the UK or Southeast Asian TikTok markets often appears in the US market one to three weeks later. Sellers who monitor FastMoss’s international data and source early based on cross-market trend migration can get into US trends in the pre-breakout phase rather than the saturation phase. This is one of the few reliable structural advantages available in the current competitive environment.
Kalodata: Historical Depth and Validation
Kalodata’s comparative advantage is historical data depth and analytical rigor. Where FastMoss optimizes for speed and EchoTik for full-funnel coverage, Kalodata gives you the cleanest long-horizon view of how a product or category has trended over time. This is most valuable for the validation function in your weekly workflow — specifically for distinguishing genuine sustained-growth categories from recurring seasonal spikes or cyclical trend patterns.
If your shortlisted product is in a category that Kalodata shows has spiked and collapsed three times in the past eighteen months, that context changes your risk assessment significantly. A product appearing to break new ground is different from one following a familiar cycle that previously attracted many sellers and delivered poor outcomes. Kalodata’s historical depth is the tool most directly relevant to avoiding the traps that burn sellers repeatedly.
Building Your Tool Workflow
The practical recommendation is to use all three tools in sequence, each for its specific purpose. FastMoss early in the week for broad discovery and cross-market signals. EchoTik during your midweek deep dive for creator diversity assessment and live-stream GMV signals. Kalodata during Thursday’s cross-platform validation for historical context on your shortlisted products. This sequencing maps each tool to its strength and prevents you from spending money on redundant data.
Most sellers do not need all three at the highest subscription tier simultaneously. Start with the one that addresses your most common research failure. If you consistently enter trends too late, FastMoss’s speed and cross-market data is your highest-value entry point. If you consistently get burned by single-creator spikes, EchoTik’s creator attribution data solves your specific problem.
Friday Debrief: Closing the Loop and Building Institutional Memory
The Friday debrief is the most neglected step in every trend scanning framework, and it is the one that separates sellers who build compounding advantage over time from those who restart from scratch every week. The weekly debrief does three things: it reviews the week’s decisions, captures the data that will make next week’s scan faster and more accurate, and builds a cumulative intelligence base that becomes increasingly valuable over time.
Reviewing the Week’s Calls
For every product on this week’s shortlist, record the final decision (proceed, conditional test, pass) and the scores that drove it. Then check in on any products you acted on from previous weeks: what happened? Did the trend follow the expected lifecycle? Did the viability score predict the outcome accurately? Where did the scoring model underperform?
This retrospective does not need to be extensive. Ten to fifteen minutes of honest review produces more learning than hours of additional research. The goal is to identify systematic biases in your own evaluation process. Are you consistently overscoring Creator Diversity because you find social proof energizing? Are you consistently underweighting Saturation because you convince yourself your creative angle will differentiate you? The debrief surfaces these patterns before they cost you significant money.
Updating Your Research Log
Maintain a running research log that records every product you shortlisted, its scores, the decision made, and the actual outcome where measurable. Over time, this log becomes your most valuable proprietary asset — a database of trend patterns in your specific categories, calibrated to your business’s specific margin structure and operational capabilities.
Sellers who have maintained research logs for six months or more typically find that their scanning sessions shorten significantly. Pattern recognition for their categories becomes faster and more reliable. They begin recognizing the early signatures of trends that look like patterns they have seen before, and they can move from discovery to decision in hours rather than days.
Seeding Next Week’s Hypothesis Block
Before closing out the week, use your debrief findings to seed Monday’s hypothesis block. Did you pass on a product this week that you want to monitor for potential entry next week? Did the week’s scan reveal adjacent category opportunities that are worth a focused hypothesis next Monday? Are there emerging creator clusters or content formats you flagged but did not have time to fully investigate?
These carryover seeds make each subsequent Monday more focused. The hypothesis block evolves from a blank-page brainstorm into a curated starting point based on accumulated intelligence. This is how the workflow compounds in value over time.
Making the Workflow Sustainable: Time, Team, and Cadence
A weekly workflow that takes twelve hours to execute will not last. Sustainability is built into the design. Across all five days of the workflow, the total active working time should be approximately three to four hours for a solo operator: fifteen minutes for Monday hypothesis setting, forty-five to sixty minutes for Tuesday-Wednesday scanning, thirty minutes for Thursday cross-platform validation, twenty minutes for Friday debrief, and additional time as needed for scoring shortlisted products.
For Solo Sellers
For a solo seller, the entire workflow should fit within a two-to-three-hour weekly block spread across four to five days. The key to maintaining this time budget is rigorous use of the hypothesis block to constrain your scanning scope. Without constraints, scanning can expand to fill any amount of available time without producing better results. With two to three focused hypotheses, your scanning session has clear boundaries.
Also consider batching your tool usage. Log into FastMoss once for your weekly discovery scan, EchoTik once for your midweek deep dive, and Kalodata once for Thursday validation. Avoid the habit of checking tools continuously throughout the week — this fragments your attention without adding proportional value.
For Small Teams
For teams of two or more, the workflow can be distributed by function. One person handles Layer 1 native tool scanning, another handles Layer 2 third-party analytics, and both contribute to Thursday cross-platform validation. The scoring session happens collaboratively, which has the additional benefit of requiring each dimension to be argued explicitly rather than assumed. Contested scores — where two team members disagree on a dimension — are often the most informative: the disagreement typically surfaces an assumption about the business that is worth examining.
Shared documentation is essential for teams. A shared research log, a common scoring template, and a consistent hypothesis-block format ensure that both team members are working with the same information and making decisions on the same criteria. Without this, you quickly drift back into informal research habits.
When to Skip the Full Workflow
Not every week requires a full five-day scan. During periods of heavy fulfillment, content production, or seasonal campaign execution, a compressed two-day version — Monday hypothesis block, Tuesday scanning of highest-priority signals only, Thursday quick cross-platform check — preserves the workflow habit without overwhelming an already-busy schedule. The worst outcome is skipping the workflow entirely for two or three weeks and losing the cadence. A compressed version, even imperfect, maintains the habit and produces actionable intelligence.
What a Mature Trend Scan Workflow Actually Looks Like After 90 Days
It is worth being specific about what you can realistically expect from this workflow over time, because the early weeks look different from the mature version.
In the first four weeks, you are calibrating. Your hypothesis blocks will be too broad. Your scoring thresholds will need adjustment as you see actual outcomes. You will catch some trends too early and some too late, and those calibration errors will teach you more than any theoretical framework can. The goal in the first month is not to find winning products on every cycle — it is to establish the habit and refine the scoring model with real data.
By weeks five through ten, the calibration work starts paying off. Your hypothesis blocks become more precise. You recognize false-positive patterns faster. Your cross-platform validation instincts sharpen. The weekly session time often decreases as pattern recognition replaces brute-force scanning. Some weeks will produce clear winners; others will produce useful negative data that sharpens your category knowledge.
By week twelve and beyond, you have a proprietary trend intelligence database. You understand which categories in your niche tend to produce reliable 30-day trends versus explosive 48-hour micro-trends, and you adjust your strategy accordingly. You know which creator archetypes in your category drive sales versus views. You know the historical saturation patterns in your categories well enough to recognize dangerous territory on sight. This institutional knowledge cannot be bought from a third-party tool — it is built through consistent application of the workflow over time.
Conclusion: The Discipline Is the Advantage
TikTok Shop moves faster than any commerce platform most sellers have encountered. The pace creates pressure — the sense that you need to be constantly watching, constantly reacting, always ready to jump on the next signal before it disappears. That pressure is real, but it is also a trap. Sellers who try to be everywhere at once, scanning continuously and reacting impulsively, rarely outperform the market. They exhaust themselves staying current while consistently arriving at trends too late and with too little conviction to execute decisively.
The weekly workflow described here is built on a different premise: that disciplined constraint produces better outcomes than constant vigilance. By defining your hypotheses before scanning, setting your thresholds before evaluating, and scoring candidates against consistent criteria, you make decisions based on pre-committed logic rather than in-the-moment enthusiasm. That is not slower. It is faster, because it eliminates the paralysis and second-guessing that slows down informal research processes.
The Actionable Starting Points
- This Monday: Write two to three product hypotheses for your category before opening any tools. Set your margin floor and saturation limit in writing.
- This week: Run one complete scan cycle using only TikTok’s native tools — Creative Center, Opportunity Center, Seller Center. No third-party tools yet. Get familiar with what native signals look and feel like before adding complexity.
- This Friday: Do a ten-minute debrief. Write down what you found, what you decided, and one thing you would do differently next week.
- By week four: Add one third-party tool to your Layer 2 scan. Choose based on your most frequent failure mode: FastMoss if you are consistently late to trends, EchoTik if you are consistently fooled by single-creator spikes, Kalodata if you need historical pattern context.
- By week twelve: Review your research log. At this point, your own historical data is your most valuable trend intelligence asset. Make sure you are capturing it consistently.
The sellers winning on TikTok Shop in 2026 are not the ones with the most data or the most sophisticated tools. They are the ones who show up every week with a clear question, a structured process for answering it, and the discipline to act fast on strong signals and walk away cleanly from weak ones. That combination — consistency, structure, and decisiveness — is available to any seller willing to build the habit. It does not require a team, an enterprise tool stack, or years of platform experience. It requires a workflow and the discipline to use it.
Start this Monday.