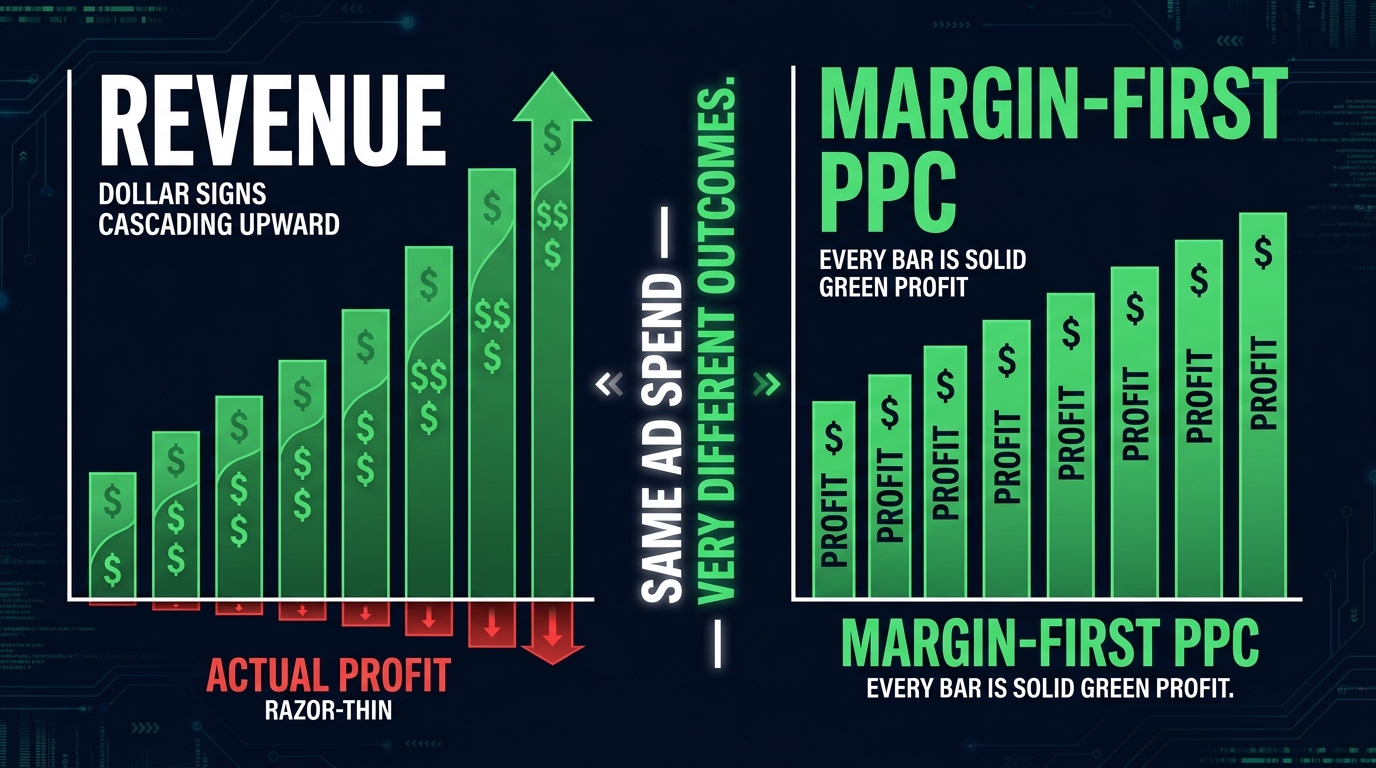

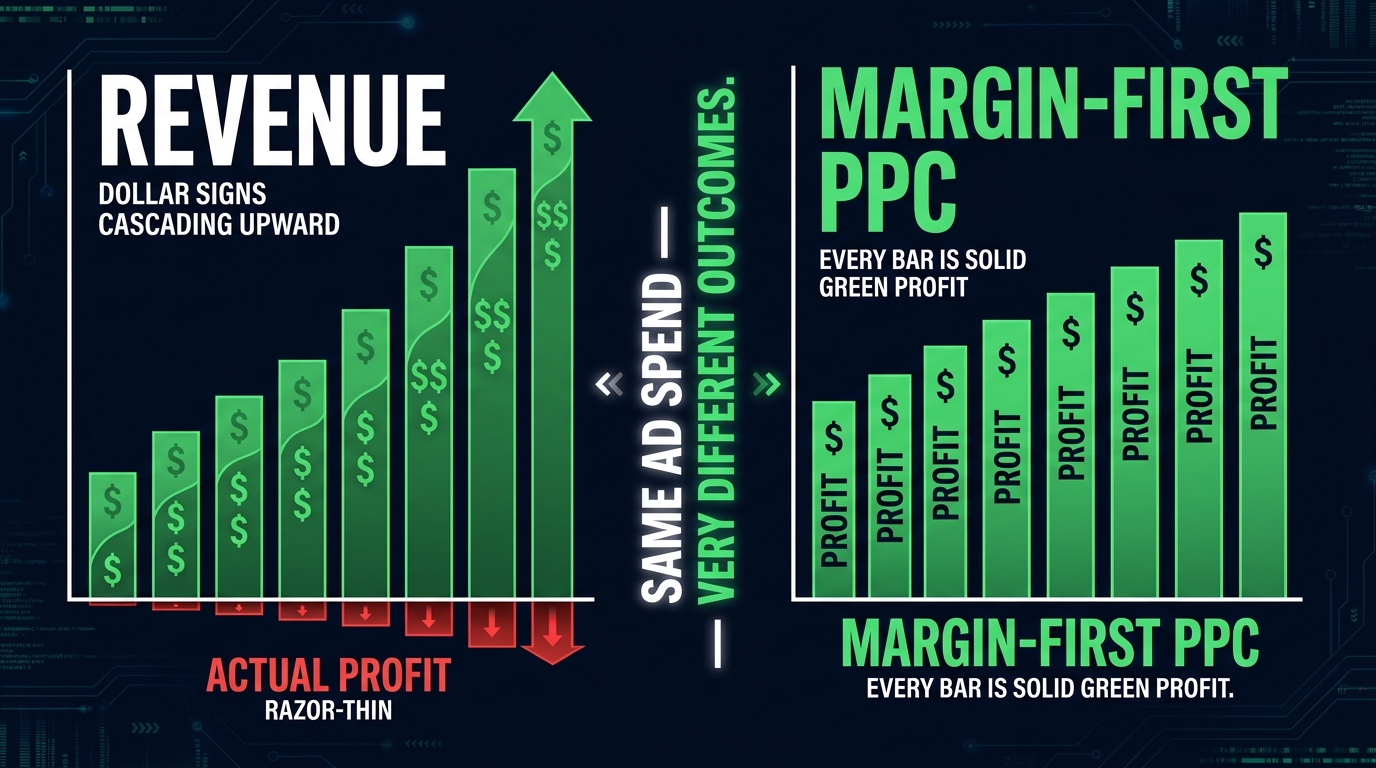
Your PPC campaigns are working. Click-through rates are healthy, conversion rates are respectable, and the ROAS dashboard is green. And yet, at the end of the month, the profit and loss statement tells a very different story. Revenue is up. Profit is barely moving.
This is not a rare problem. It is, arguably, the defining problem of performance marketing in 2026. As ad platforms have grown more automated, more self-serving in their optimization goals, and more opaque about what they actually do with your budget, the gap between “ad performance” and “business performance” has become a gulf that swallows brands whole.
The root cause is structural: PPC campaigns, at nearly every level of maturity, are built around revenue metrics. Revenue per click. Revenue per conversion. Return on ad spend. These numbers tell you how much money came in. They tell you almost nothing about how much of it you kept.
Profit-first PPC is the discipline of rebuilding that structure from the ground up — replacing revenue as the North Star with margin, and then using margin data to govern bids, budgets, campaign architecture, and SKU prioritization. It is not a tweak. It is a complete reorientation of how paid media decisions get made.
This article walks through exactly how to do that: from the math of contribution margin, to the mechanics of margin-tier campaign segmentation, to the operational steps of a margin-based account audit. The goal is not a framework you file away. It is a working method you can start applying this week.
Why ROAS Has Always Been a Revenue Metric — Not a Profit Metric
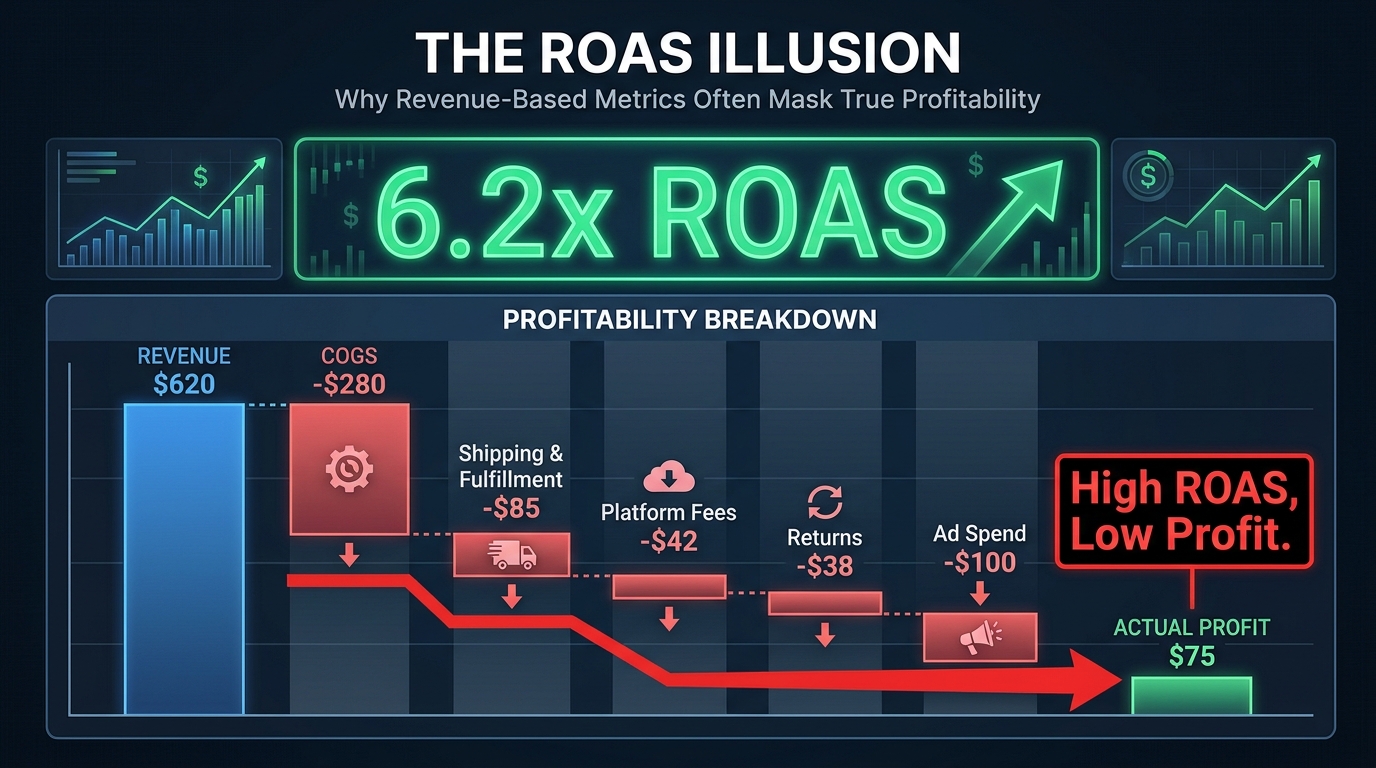
ROAS — Return on Ad Spend — is the ratio of ad-attributed revenue to ad spend. At a surface level, it answers a sensible question: for every dollar I put in, how many dollars of revenue came out? A 5x ROAS means $5 of revenue for every $1 spent. Sounds healthy. Often is not.
Here is the structural flaw: ROAS counts revenue. Revenue is not profit. Revenue is what customers pay you before the costs of actually serving them are subtracted. And in e-commerce and performance marketing specifically, those costs are substantial, varied, and largely invisible to the ROAS calculation.
The Anatomy of a Misleading ROAS Number
Consider a product selling for $100 with a cost of goods of $40. The ad campaign generates $1,000 in revenue from $100 in spend — a 10x ROAS. Impressive. But here is what that number is not accounting for:
- Fulfillment and shipping: $12 per order × 10 orders = $120
- Platform or marketplace fees: roughly 8–15% of revenue = $80–$150
- Returns and refunds: even a 5% return rate on this campaign costs $50 in reversed revenue plus restocking
- Payment processing fees: typically 2–3% = $20–$30
- Promotional discounts: if a 10% coupon drove conversions, subtract another $100
Strip all of that away, and the 10x ROAS campaign might be generating $50–$150 in actual profit on $100 of ad spend — a 1.5x return on a fully loaded basis. Still positive, but nowhere near as efficient as the dashboard suggested. And on thinner-margin products, the same ROAS could represent a net loss.
The Scale Problem: ROAS Gets More Dangerous as Budgets Grow
The ROAS illusion compounds at scale. When you are spending $1,000 per month, the hidden costs are manageable. When you are spending $50,000 per month across a catalog of 300 SKUs, you are making budget allocation decisions — which products to push, which to scale — based on a metric that is systematically blind to cost structure. The products with the best ROAS are often the ones with the highest average order value, not the highest margin. And high-AOV products frequently carry the highest fulfillment, return, and processing costs.
A 2026 survey of mid-market e-commerce brands found that more than 60% of respondents had at least one product category where their target ROAS was below the break-even ROAS for that category — meaning they were structurally guaranteeing a loss on those products every time the algorithm hit its stated “goal.” They just could not see it in the reporting.
The fix is not to stop using ROAS entirely. It is to understand what ROAS can and cannot tell you, and to layer in the margin data that makes it meaningful. That process starts with understanding your true contribution margin at the product level.
The Contribution Margin Stack: Every Cost That Eats Your PPC Profit
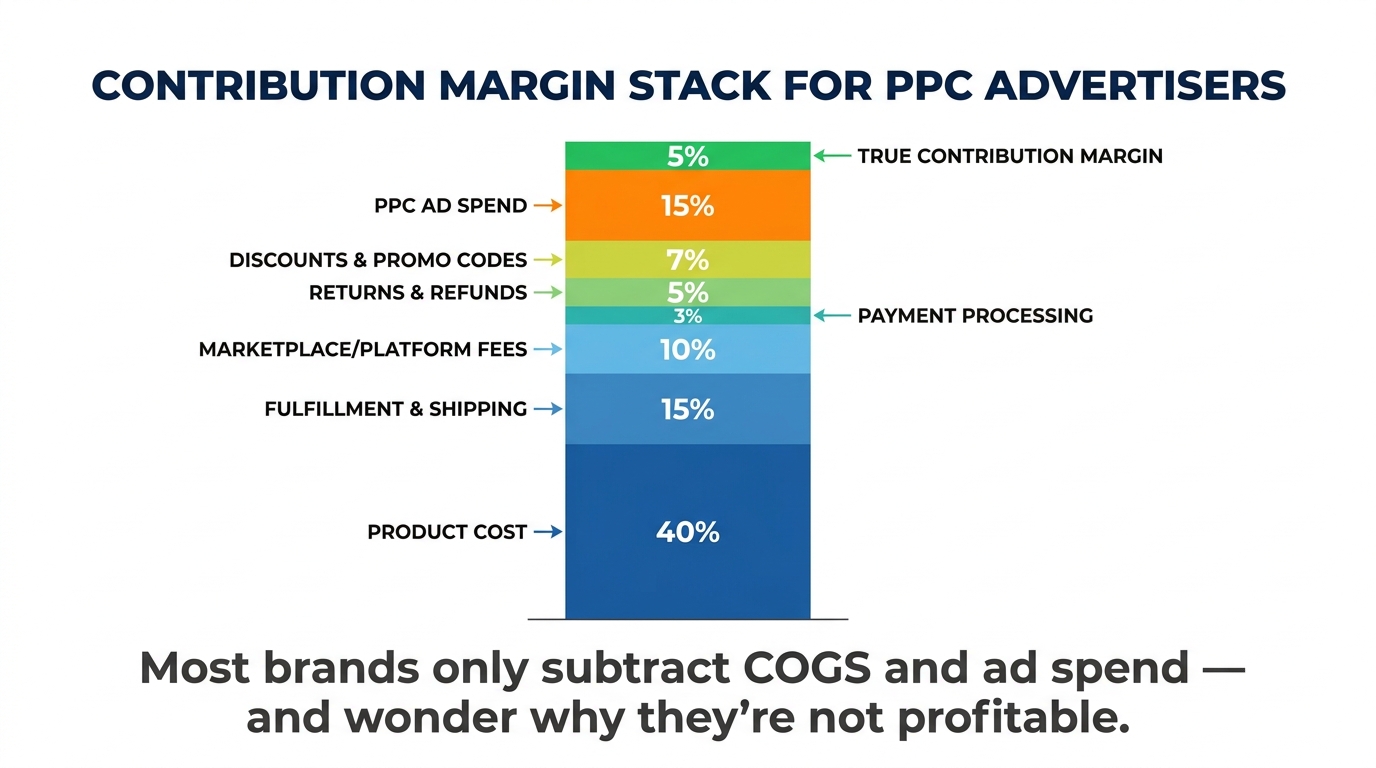
Contribution margin is the profit that remains after all variable costs have been subtracted from revenue — costs that scale directly with each order or unit sold. It is the number that tells you how much every incremental sale actually contributes to covering your fixed costs and generating real profit.
For PPC purposes, contribution margin is the only number that matters. Everything else is an abstraction.
Building Your Per-SKU Contribution Margin Calculation
The formula looks like this:
Contribution Margin = Net Revenue − (COGS + Fulfillment + Platform Fees + Payment Fees + Returns + Discounts)
Each of these variables deserves careful attention, because the places where brands most commonly undercount their variable costs are also the places where the most profit disappears.
Cost of Goods Sold (COGS): This should be your fully landed cost — not just the supplier invoice price, but also inbound freight, import duties, packaging materials, and any quality control costs. Brands that use only the supplier unit cost without accounting for freight and duties routinely understate COGS by 15–30%, especially when importing internationally.
Fulfillment and shipping: Outbound shipping, warehouse pick-and-pack fees, and any carrier surcharges. If you use third-party logistics (3PL), this includes their per-order handling fee. If you use FBA, it includes the FBA fulfillment fee and any monthly storage fees allocated per unit. This cost is often product-weight-and-dimension dependent — a critical reason why margin varies so dramatically across a catalog even when selling prices look similar.
Platform and marketplace fees: Amazon referral fees typically run 8–15% of the sale price depending on category. Shopify and Stripe combined typically cost 2.5–3%. Direct D2C brands on their own site may have lower fee loads, but rarely zero. These fees are often treated as overhead rather than variable costs, which is a mistake — they scale directly with revenue and must be accounted for at the product level.
Returns and refunds: Even modest return rates have outsized margin impact. A 10% return rate on a $50 product means you are effectively losing the fulfillment cost twice on every returned unit — once to ship out, once to receive back — plus any restocking labor. For soft goods, electronics, and footwear, return rates can exceed 20–30%, which changes the entire margin profile.
Discounts and promotions: If PPC campaigns are running with coupon codes, lightning deals, or promotional pricing, the discount must be reflected in the margin calculation for the transactions driven by that spend. A 15% coupon attached to a campaign that already had thin margins can push the contribution margin negative.
Why Most PPC Accounts Only Subtract Two Costs
The uncomfortable reality is that most PPC practitioners — including experienced ones — calculate something like this when assessing campaign profitability:
Revenue − COGS − Ad Spend = Profit
This omits fulfillment, fees, returns, and discounts. In many product categories, those omitted costs add up to 20–35% of revenue. Campaigns that look profitable on a simplified COGS-minus-ad-spend basis are often losing money when the full variable cost stack is applied. Getting this right is not optional. It is the prerequisite for everything else in a profit-first PPC strategy.
Calculating Break-Even ROAS for Every Product in Your Catalog
Once you have a reliable per-SKU contribution margin, you can calculate the single most important number in profit-first PPC: break-even ROAS. This is the minimum ROAS a campaign must achieve before it stops destroying value and starts creating it.
The formula is straightforward:
Break-Even ROAS = 1 ÷ Pre-Ad Contribution Margin %
Where “pre-ad contribution margin %” is your contribution margin expressed as a percentage of revenue, calculated before ad spend is subtracted. Ad spend is intentionally excluded from this denominator because break-even ROAS needs to tell you: “How much revenue do I need per ad dollar to cover all my other costs?”
A Practical Example with Three SKUs
Consider three products in the same catalog — a protein supplement brand:
SKU A — Premium Whey (30-serve tub): Sells at $65. COGS $18, fulfillment $7, platform fees $6.50, returns 3% ($1.95), payment fees $1.95. Total variable costs (ex-ads): $35.40. Pre-ad margin: $29.60 ÷ $65 = 45.5%. Break-even ROAS: 1 ÷ 0.455 = 2.20x.
SKU B — Budget Pre-Workout (20-serve): Sells at $28. COGS $11, fulfillment $6, platform fees $2.80, returns 5% ($1.40), payment fees $0.84. Total variable costs (ex-ads): $22.04. Pre-ad margin: $5.96 ÷ $28 = 21.3%. Break-even ROAS: 1 ÷ 0.213 = 4.69x.
SKU C — Subscription Bundle (3-month supply): Sells at $120. COGS $38, fulfillment $9, platform fees $12, returns 2% ($2.40), payment fees $3.60, bundle discount $10. Total variable costs (ex-ads): $75. Pre-ad margin: $45 ÷ $120 = 37.5%. Break-even ROAS: 1 ÷ 0.375 = 2.67x.
The critical insight here: if these three SKUs were in the same campaign with a blended ROAS target of, say, 4x, you would be over-spending on SKU A (which only needs 2.2x to break even and could profitably absorb far more spend), under-spending on SKU C (which needs 2.67x but has a healthy profit window above that), and barely staying viable on SKU B (which needs 4.69x just to break even — meaning a 4x ROAS target is actively destroying profit on this product).
Target ROAS vs. Break-Even ROAS: Setting the Right Gap
Break-even ROAS is the floor. Target ROAS should be set higher than break-even by a margin that reflects your desired profitability. A common approach is to set Target ROAS at 120–150% of break-even, giving you a profit cushion while still allowing the bidding algorithm room to operate. For SKU A above with a break-even of 2.20x, a reasonable target ROAS might be 2.64x–3.30x — not the platform’s default 4x or 5x blended target.
For thin-margin products like SKU B, the math often suggests a hard truth: the break-even ROAS is so high that competitive bidding in paid search becomes structurally unprofitable at almost any realistic conversion rate. These products may belong in organic channels, bundles, or upsell sequences — not standalone PPC campaigns.
Margin Tier Segmentation: The Architecture of a Profit-First Account
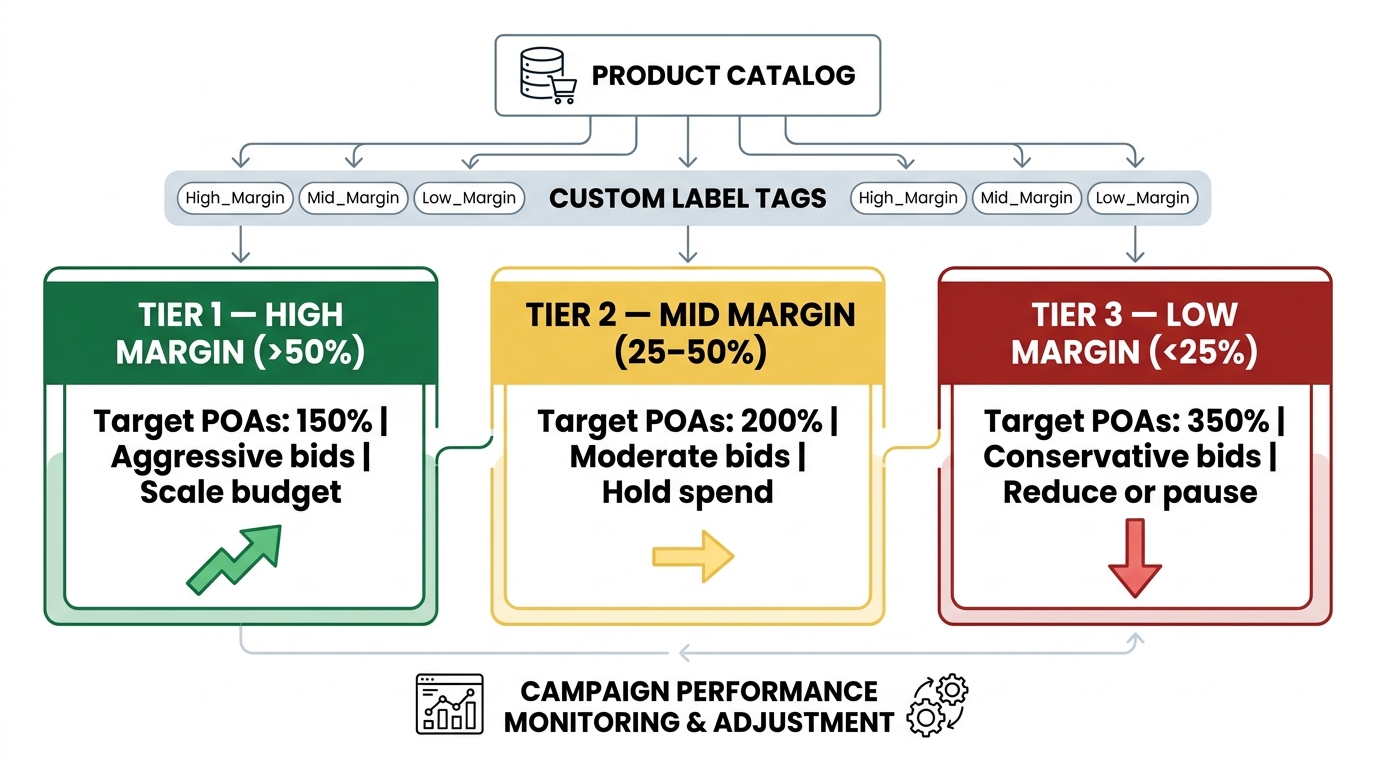
With break-even ROAS calculated per SKU, the next step is restructuring your campaign architecture so that margin drives campaign separation, bid targets, and budget allocation. This is called margin tier segmentation, and it is the operational backbone of profit-first PPC.
The Three-Tier Model
Most catalogs can be meaningfully segmented into three margin tiers, with specific bid and budget treatment for each:
Tier 1 — High Margin (Pre-ad contribution margin above 40–50%): These are your growth engines. They have comfortable room between break-even ROAS and competitive market ROAS, which means you can bid aggressively, tolerate higher CPCs, and accept lower ROAS in exchange for volume and market share. Budget priority: maximum. Bid strategy: Target ROAS set at 120–130% of break-even, or Maximize Conversion Value with a ROAS floor. The goal is to buy as much profitable volume as the market will yield.
Tier 2 — Mid Margin (Pre-ad contribution margin between 20–40%): Solid performers that require more careful management. The gap between break-even ROAS and realistic market ROAS is narrower, so bid discipline matters more. Budget treatment: steady, with caps. Bid strategy: Target ROAS set at 140–160% of break-even, to preserve the profit margin even if volume is somewhat constrained. Watch return rates closely — a 2% increase in returns can tip a mid-margin product into break-even or loss territory.
Tier 3 — Low Margin (Pre-ad contribution margin below 20%): High-maintenance products that should be advertised with extreme caution. Their break-even ROAS is high, meaning you need very efficient conversion rates to make paid traffic work. Budget treatment: minimal or zero. Bid strategy: either Maximize Conversions with a very aggressive CPA cap derived from the unit economics, or exclusion from campaigns entirely in favor of organic or bundling strategies.
Implementing Tiers via Custom Labels (Google Shopping and PMax)
In Google Shopping and Performance Max campaigns, margin tiers are implemented through Custom Labels in your product feed. The Merchant Center feed accepts up to five custom label fields (custom_label_0 through custom_label_4), and the values you assign become selectable filters in your campaign structure.
The implementation workflow is:
- Calculate pre-ad contribution margin for every active SKU in your catalog.
- Assign a margin tier label (e.g., “high_margin”, “mid_margin”, “low_margin”) to each SKU.
- Upload those labels to your product feed via Merchant Center supplemental feed or direct feed update.
- Create separate campaigns (or asset groups within PMax) for each margin tier.
- Set distinct Target ROAS values per campaign based on the break-even ROAS calculation for each tier.
- Assign budget proportionally — more to Tier 1, less to Tier 3.
The immediate benefit is that the algorithm stops pooling your budget across products with wildly different profitability profiles. A 4x ROAS campaign that mixes 55%-margin products with 12%-margin products is actually running two very different businesses simultaneously. Separating them forces appropriate optimization targets and reveals true performance by margin band.
Multi-Dimensional Segmentation: Adding a Second Variable
The most sophisticated practitioners in 2026 are moving beyond single-dimension margin tiering to multi-dimensional segmentation — combining margin with at least one other performance variable. The most common second dimension is velocity: whether a product is a high-velocity seller or a slow mover.
A high-margin, high-velocity product is your ideal PPC candidate — advertise it everywhere, maximize spend. A high-margin, low-velocity product may need different creative or different match types to unlock demand. A low-margin, high-velocity product is a volume machine that requires extreme bid discipline to stay profitable. And a low-margin, low-velocity product is almost never worth advertising at full price.
This two-by-two matrix creates four distinct campaign strategies from what might previously have been one undifferentiated campaign. The granularity is more work upfront but produces compounding returns over time as the algorithm learns distinct, coherent optimization signals rather than blended noise.
POAS: The Metric That Makes Margin Optimization Visible
POAS — Profit on Ad Spend — is the direct margin-equivalent of ROAS. Where ROAS measures revenue per ad dollar, POAS measures profit per ad dollar. The formula is:
POAS = (Revenue × Gross/Contribution Margin %) ÷ Ad Spend
Or equivalently, expressed in absolute terms: POAS = Gross Profit Generated ÷ Ad Spend.
A POAS of 2.0 means you are generating $2 of gross profit for every $1 of ad spend. A POAS below 1.0 means you are spending more on ads than the gross profit those ads generate — you are destroying margin with every click.
How POAS Changes Optimization Decisions
POAS reframes the optimization question entirely. Consider two campaigns:
- Campaign A: ROAS 8x, average margin 15%. POAS = 8 × 0.15 = 1.20x. You are making $1.20 of gross profit per $1 spent.
- Campaign B: ROAS 3x, average margin 55%. POAS = 3 × 0.55 = 1.65x. You are making $1.65 of gross profit per $1 spent.
Based purely on ROAS, Campaign A looks dramatically better. Based on POAS, Campaign B is nearly 40% more efficient at generating actual profit. Without POAS, budget would flow toward Campaign A. With POAS, it flows toward Campaign B.
This reversal — where a lower-ROAS campaign is the more profitable one — is extremely common in catalogs with diverse margin profiles, and it is almost entirely invisible to standard ROAS-based optimization.
Setting POAS Targets by Tier
Because POAS is margin-adjusted, the minimum viable POAS is always 1.0 (break-even). But as with ROAS, you want a target that reflects your desired profitability above break-even. The following target ranges are broadly used:
- High-margin products: Target POAS 1.50–2.00x (generating $1.50–$2 of gross profit per $1 spent)
- Mid-margin products: Target POAS 2.00–2.50x (a higher ratio is needed because margins are thinner and there is less buffer against variance)
- Low-margin products: Target POAS 3.00x+ (the high target reflects how little room there is for inefficiency — or a signal that these products should not be in PPC at all)
POAS is also the correct metric to use when evaluating overall account health. A rising blended ROAS that correlates with a flat or falling blended POAS is a red flag: you may be getting more efficient at generating revenue while simultaneously becoming less efficient at generating profit — often because the algorithm is pushing volume on your high-revenue, low-margin products.
Margin-Based Bidding in Practice: Google Ads, Shopping, and Performance Max
Understanding the theory of margin-based bidding is one thing. Making the platforms actually execute it is another. Here is how margin-first PPC translates into concrete bid strategy decisions across the major campaign types.
Feeding Profit Values into Smart Bidding
Google’s Smart Bidding suite — Target ROAS, Maximize Conversion Value — optimizes toward the conversion values you report. The default setup reports revenue as the conversion value. But if you report margin-adjusted values instead, the algorithm will optimize for profit rather than top-line revenue.
The mechanism works like this: instead of sending the transaction revenue ($100) as the conversion value in your Google Tag or conversion import, you send the contribution margin in dollars ($45). Now when Google’s bidding model tries to maximize “conversion value,” it is maximizing margin dollars, not revenue dollars. A $100 sale with a 20% margin reports $20. A $60 sale with a 60% margin reports $36. The algorithm learns to prefer the latter.
This approach requires a reliable, real-time margin calculation that can be passed at the order level — usually via a data layer push from your e-commerce platform. It is technically straightforward on Shopify with a custom theme modification or a server-side tagging setup. The key is accuracy: if your margin calculation is wrong or inconsistent, you are teaching the algorithm to optimize toward a corrupted signal.
Performance Max: Margin Segmentation at Scale
Performance Max campaigns present a particular challenge for margin-first PPC because they were explicitly designed to pool signals across channels, products, and audiences — the opposite of the segmentation approach described above. Running a single PMax campaign across a mixed-margin catalog is one of the most common ways that margin discipline breaks down at scale.
The 2026 best practice for margin-aware PMax operation is to run separate PMax campaigns per margin tier, each with its own asset group, budget, and ROAS target derived from the tier’s break-even calculation. Within each campaign, custom label filters in the product feed ensure that only the appropriate SKUs are served.
There is an important caveat: Google’s PMax campaigns require a minimum data threshold to exit the learning phase, typically around 30–50 conversions per month per campaign. Running too many separate PMax campaigns with insufficient data in each can leave every campaign perpetually in learning mode, which produces erratic bidding. The practical solution is to consolidate where necessary — combining high and mid-margin tiers if either lacks sufficient volume — rather than fragmenting to the point of data starvation.
Search Campaigns: Keyword-Level Margin Signals
In standard search campaigns, margin segmentation cannot be done at the product level in the same way as Shopping, because search campaigns do not operate on a product feed. Instead, margin signals are applied at the keyword and ad group level by mapping search intent to product margin.
Keywords that predominantly drive conversions on high-margin SKUs should have more aggressive bids and higher CPC ceilings. Keywords that funnel traffic to low-margin products should be treated with extreme bid discipline or excluded from the campaign structure and redirected to organic. This requires knowing which keywords convert to which products — a query-to-product mapping that requires conversion data at the SKU level, not just at the campaign level.
Enabling value-based bidding in search campaigns, combined with margin-adjusted conversion values passed via the data layer, is the most complete way to implement margin-first optimization in search. Without that, keyword-level bid adjustments based on known product mappings are the practical alternative.
The Profit-First PPC Audit: Finding Where Margin Dies in Your Account
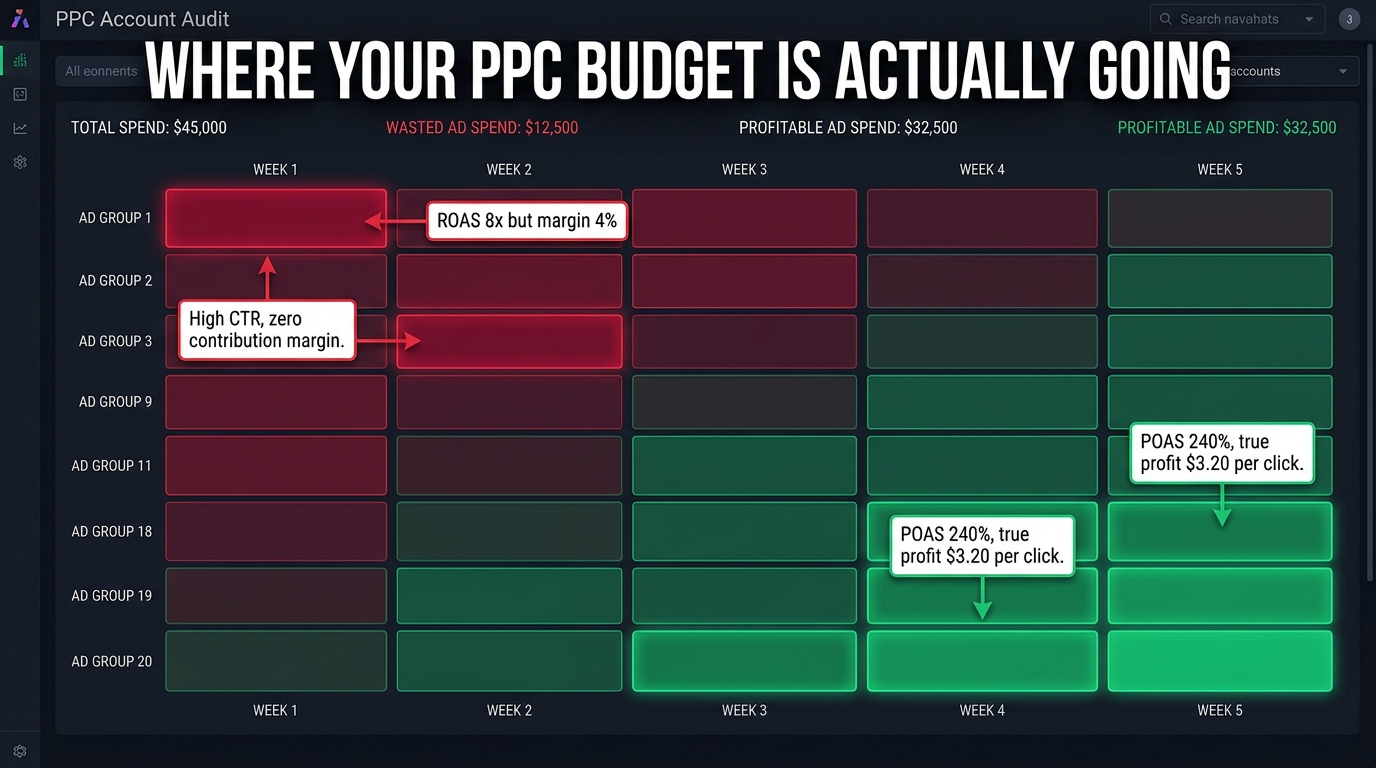
Before you can rebuild a campaign around margin, you need to understand where in your current account margin is being destroyed. This is the purpose of a profit-first PPC audit — a systematic process of layering margin data onto performance data to identify the specific campaigns, ad groups, products, and keywords that look fine on ROAS but are unprofitable on a fully loaded basis.
Step 1: Build a Per-SKU Profitability Table
Pull the last 90 days of campaign data from your ad platform at the product or SKU level. For Google Shopping, this is the Product Groups report. For Amazon, it is the Campaign report segmented by ASIN. You need, at minimum: impressions, clicks, spend, revenue, conversions, and average CPC.
In a separate sheet, build your contribution margin table with every active SKU — COGS, fulfillment, fees, return rate, and the resulting pre-ad margin percentage and break-even ROAS.
Join these two tables on the product identifier. You now have, for each SKU, both the actual ROAS achieved and the ROAS required to break even. Any row where actual ROAS is below break-even ROAS is a product that is losing money in your campaigns — regardless of what the aggregate campaign-level metrics say.
Step 2: Identify the “High ROAS Trap” Products
Sort your joined table by actual ROAS, descending. Now look at the products at the top of the list. Some will genuinely be profitable — high ROAS on high-margin SKUs, well above break-even. Others will show high ROAS but have thin margins such that even the apparently great ROAS is barely above or below break-even. These are your “High ROAS Trap” products — they look great in the dashboard and would be prioritized for additional spend under a revenue-first approach, but they are actually producing minimal or negative profit contribution.
For each of these products, calculate the POAS: multiply their ROAS by their contribution margin percentage. If the resulting POAS is below 1.5x, flag it for bid reduction or exclusion from scale campaigns.
Step 3: Quantify Wasted Spend by Category
Categorize your current spend across three buckets:
- Profitable spend: Ad spend generating a POAS above your target threshold. This is money well deployed.
- Sub-target spend: Ad spend generating a POAS between 1.0x and your target. This is marginally profitable but below the desired return. Bids should be reduced.
- Destructive spend: Ad spend on products where POAS is below 1.0x — meaning every dollar spent is destroying gross profit. This spend should be paused or redirected immediately.
Most accounts that have not been audited with this framework find that 20–35% of their total spend falls into the sub-target or destructive category. This is not a failure of the campaigns — it is a predictable consequence of optimizing to a revenue metric that cannot see cost structure. The campaigns were doing exactly what they were told. They were just told the wrong thing.
Step 4: Review Search Term Reports Through a Margin Lens
For search and shopping campaigns, pull the search term report for the same 90-day period. Look for search queries that are driving significant spend but converting predominantly on low-margin products, or queries with high click volume but low conversion rates that are burning budget without generating even revenue, let alone profit.
Queries in the first category should be negated from campaigns serving high-margin products and, if served at all, moved to a tightly controlled low-margin campaign with strict bid caps. Queries in the second category should be negated outright.
The search term audit through a margin lens often surfaces a category of “aspirational queries” — broad or modified-broad keywords that bring in lots of looker traffic for high-value search terms but convert at rates so low that even the best-margin product cannot support the CPC. These are common in competitive categories (supplements, electronics, apparel) where branded terms convert at 8–15% but generic category terms convert at 1–3%.
Budget Reallocation: Moving Spend to Where Profit Actually Lives
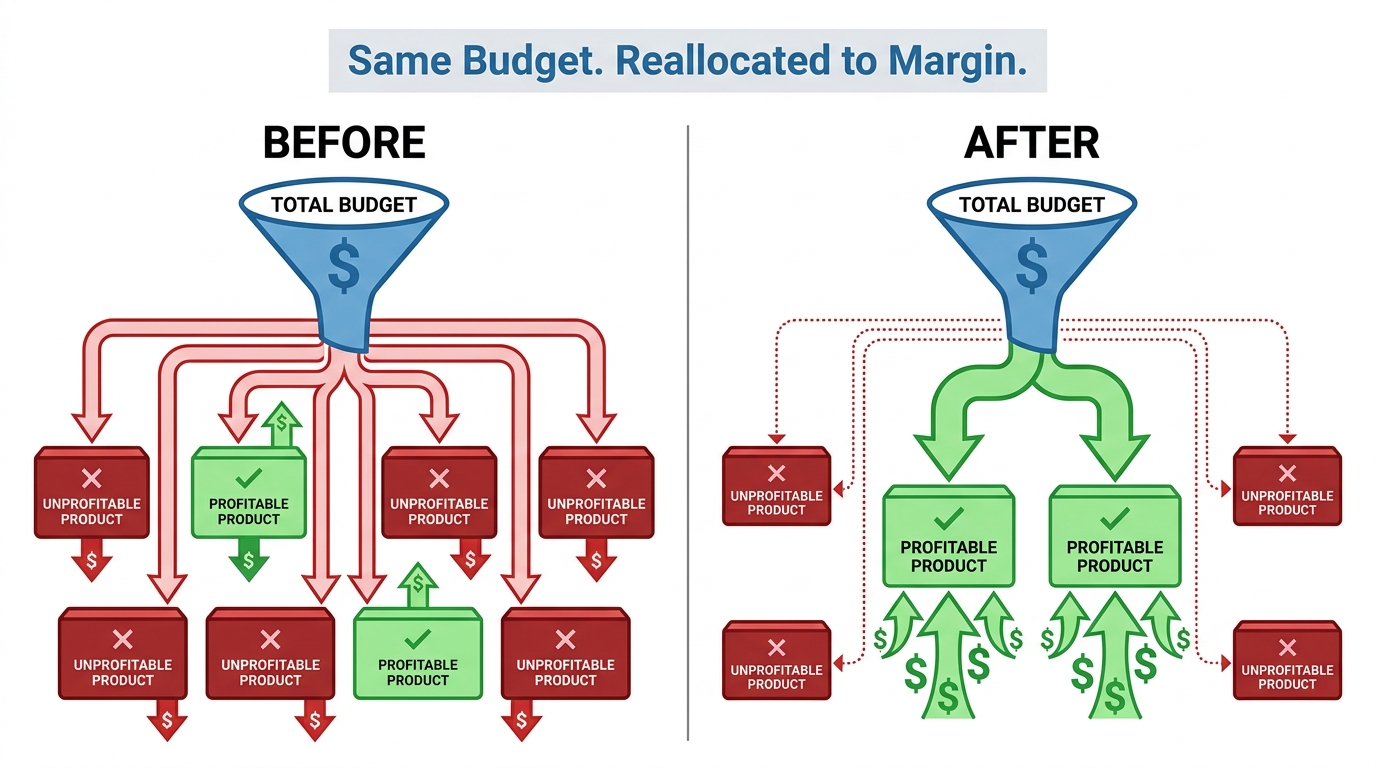
The audit tells you where profit is being destroyed. The reallocation step is where you actually move money. This is often the most psychologically difficult part of a profit-first rebuild, because it typically means reducing spend on campaigns that “look good” and cutting products that have high revenue but low margin — changes that may feel like a step backward before they feel like a step forward.
The 30-Day Transition Protocol
A cold-stop approach — immediately cutting all low-margin campaigns and reallocating everything to high-margin products — will almost certainly trigger a learning phase reset across your entire account. Platform algorithms need continuity of data to maintain bid calibration. The recommended approach is a 30-day phased transition:
Week 1–2: Reduce bids on sub-target and destructive-spend products by 20–30%. Do not pause yet — you want to see how the algorithm responds to the bid reduction before making structural changes. Tag the products internally so you can track their performance separately.
Week 2–3: Apply the proceeds (budget freed from bid reductions) to Tier 1 high-margin campaigns. Increase budgets incrementally — 15–20% per week rather than doubling overnight. Monitor for impression share changes and watch the POAS trend at the campaign level.
Week 3–4: Review conversion data for the bid-reduced products. Products whose POAS has moved into target range at lower bids should be stabilized at those bid levels. Products that remain below target despite the reduction should be paused from solo campaigns and either excluded entirely or moved to a low-priority catch-all campaign with a very tight ROAS floor.
What Margin-Based Budget Reallocation Actually Produces
Case data from brands that have executed margin-based budget reallocations consistently show a predictable pattern: total revenue initially dips 5–15% as low-margin volume is removed from campaigns. But gross profit and contribution margin either hold steady or improve, because the removed volume was generating negligible or negative profit contribution. Within 60–90 days, as high-margin campaigns scale with the reallocated budget, total revenue tends to recover — often exceeding the original level — while profit continues to grow.
The reason this works is that high-margin products typically have more elastic demand relative to spend than the blended-account metrics suggest. When they were sharing a budget with low-margin products, they were being under-funded. Giving them dedicated, appropriately sized budget often reveals that the market can absorb significantly more spend at profitable economics.
The Catalog Rationalization Question
Budget reallocation will, in some cases, surface a harder strategic question: what to do with products that have such poor margin economics that no PPC strategy can make them profitable? The honest answer, in most cases, is that these products should not be in paid media at all. They may have a place in organic search, as upsell components of higher-margin bundles, or as loss-leader acquisition products only when followed by high-margin LTV.
Recognizing that some products simply do not belong in PPC is not a campaign management failure. It is the insight that margin-first analysis was specifically designed to surface. Continuing to advertise unprofitable products because “the campaign was already running” or “we need the revenue” is exactly the behavior that turns a growing revenue line into a stagnant profit line.
Common Mistakes That Derail the Shift to Margin-First PPC
The theory of profit-first PPC is clean. The execution is where most accounts stumble. These are the most frequent failure modes, and what to do about each.
Mistake 1: Using Blended Margin Instead of SKU-Level Margin
A catalog with 200 products might have a blended contribution margin of 35%. Using that single number as the margin input for every product’s break-even ROAS calculation will produce wildly inaccurate targets for most of the catalog. Product A with a 60% margin has a break-even ROAS of 1.67x. Product B with a 10% margin has a break-even ROAS of 10x. Treating both as 35%-margin products sets the wrong target for everyone.
The fix is non-negotiable: calculate margin at the individual SKU level, even if it requires a manual build of a per-product cost model. For large catalogs, segment into product families or price bands as a starting point, but move toward individual SKU precision as quickly as data quality allows.
Mistake 2: Setting Margin-Based Targets but Not Adjusting Campaign Structure
Changing bid targets without changing campaign architecture is a half-measure. If high and low-margin products remain in the same campaign, the algorithm will still allocate spend across them according to its own optimization logic, regardless of what the human-set ROAS target says. Smart Bidding does not “target” on a per-product basis within a campaign — it optimizes the campaign portfolio. Margin targets only become actionable when the campaign structure separates products into margin-aligned groupings.
Mistake 3: Ignoring the Return Rate Variable
Return rates are frequently treated as a finance department concern rather than a PPC variable. But return rate has a direct and significant impact on contribution margin, and therefore on break-even ROAS. A product with a 30% return rate has a materially lower effective margin than the same product with a 3% return rate — even if all other costs are identical. Campaigns that drive high-return customers (a common outcome of very broad match types or misleading ad copy) are destroying more margin than the ROAS metric will ever show.
Include actual return rates in your margin calculation, and build a return-rate monitoring workflow into your monthly campaign review. Categories with rising return rates are an early warning signal of declining campaign profitability that ROAS will not surface until it’s already material.
Mistake 4: Treating Margin-First PPC as a One-Time Restructure
Product costs change. Supplier pricing increases. Shipping surcharges get added. Platform fee structures evolve. Return rates shift with product changes or new customer acquisition audiences. None of these changes are automatically reflected in your campaign structure or bid targets unless you maintain a live margin model that feeds into your PPC setup.
Treat your margin model as a living document. Set a monthly review cadence where cost inputs are refreshed, break-even ROAS values are recalculated, and any products that have crossed tier boundaries are moved to their new campaign assignment. The brands that sustain profit-first PPC over time are the ones that build the margin review into their standard operating rhythm — not just into a one-time account restructure.
Mistake 5: Failing to Align PPC with Finance and Merchandising
Margin-first PPC requires data that typically lives outside the marketing department: landed COGS from procurement, fulfillment costs from operations, return rate data from customer service, and fee structures from the finance team. When PPC is run as a siloed function without access to this data, it defaults to revenue optimization by necessity — not because the team does not care about profitability, but because profitability data is simply not available.
Building the organizational bridges to get per-SKU cost data into the marketing team’s hands is often harder than the technical implementation of margin-based bidding. But it is also the most durable competitive advantage in paid media: brands that can act on real-time margin data will always make better bid decisions than competitors optimizing blind.
Putting It Together: A Margin-First PPC Operating Model
Profit-first PPC is not a campaign type or a platform feature. It is an operating model — a way of making paid media decisions that keeps margin, not revenue, as the primary variable. Here is how the ongoing operating rhythm looks once the initial rebuild is complete.
Monthly: Margin Model Refresh
Once per month, update your per-SKU cost model. Check for changes in COGS, shipping rates, platform fees, and return rates. Recalculate break-even ROAS for any changed SKUs. Identify any products that have crossed tier boundaries and update their campaign assignment and bid targets accordingly. This review should take 2–4 hours for a well-organized catalog and prevents the margin drift that silently erodes account profitability over time.
Weekly: POAS Performance Review
Each week, pull POAS data at the campaign and product group level (not just ROAS). Flag any campaigns where POAS has fallen below target. For campaigns trending below target, review the search term report and product performance to identify what is driving the decline — CPCs rising, conversion rates falling, or mix shift toward lower-margin products. React with bid adjustments, not just budget cuts.
Quarterly: Catalog and Budget Strategy Reset
Every quarter, revisit the fundamental question: which products should be in PPC at all? Catalog composition changes, new products launch, old products get repriced or discontinued. A quarterly audit ensures that your campaign architecture reflects the current catalog’s margin profile rather than the profile it had six months ago. This is also the time to assess whether budget allocation across tiers still reflects where the highest-POAS opportunities lie, and to make structural changes before they become urgent.
Conclusion: Profit Is the Performance Metric That Actually Matters
The shift from revenue-first to margin-first PPC is, at its core, a shift in what you are trying to build. Revenue-first campaigns are optimized for topline growth — more clicks, more conversions, more spend at an acceptable ROAS. Margin-first campaigns are optimized for sustainable business performance — profit generated per dollar invested, controlled by real unit economics at the SKU level.
The tools to execute margin-first PPC exist today. Value-based bidding with margin-adjusted conversion values, custom label-based tier segmentation, POAS as a primary reporting metric, and per-SKU break-even ROAS calculations are all available to any advertiser willing to do the foundational work of building an accurate product-level cost model.
What separates the brands that successfully operate this way from those that remain stuck in revenue optimization is not technical sophistication — it is organizational alignment. Getting the cost data, maintaining the margin model, and making budget decisions that sometimes sacrifice short-term revenue growth for long-term profit efficiency requires buy-in from finance, operations, and leadership, not just the PPC team.
But the competitive advantage for those who do it is substantial. In markets where competitors are systematically over-bidding on low-margin products and under-funding their high-margin growth engines, a profit-first operator has a structural edge: they are growing a business, not just a revenue number.
Key Actionable Takeaways
- Build a per-SKU contribution margin model that includes COGS, fulfillment, platform fees, return rates, payment processing, and discounts. This is the non-negotiable foundation for everything else.
- Calculate break-even ROAS for every product: use the formula 1 ÷ pre-ad contribution margin %. This number is your bidding floor — not the platform’s default target.
- Segment campaigns by margin tier (high/mid/low) using custom labels in Shopping and PMax. Set distinct Target ROAS values and budgets per tier based on actual break-even economics.
- Switch your primary optimization metric from ROAS to POAS (Revenue × Margin % ÷ Ad Spend). POAS is the only dashboard metric that tells you whether ads are actually building profit.
- Audit your current account by joining ad performance data with contribution margin data per SKU. Identify and quantify destructive spend — money going to products where POAS is below 1.0x.
- Reallocate budget in phases over 30 days to avoid learning phase disruptions. Reduce bids on sub-target products before pausing, and scale high-margin campaigns incrementally.
- Set a monthly margin model refresh cadence so that campaign structure reflects current cost reality rather than last quarter’s assumptions.
- Align with finance and operations to ensure that real-time cost changes flow into your margin model and, from there, into your bid strategy — making profit-first optimization a dynamic process rather than a static restructure.