
When Amazon announces that average FBA fulfillment fees have risen by “approximately $0.08 per unit” in 2026, that framing is technically accurate and practically misleading. It’s the kind of number that sounds manageable on a slide deck but obscures the real story: the total fee stack — base fulfillment plus fuel surcharge plus inbound placement plus low-inventory penalties plus aged inventory surcharges plus storage — has grown far more material than any single line item suggests.
Sellers who benchmark only against the headline increase are walking into a margin problem they didn’t budget for. The ones who’ve protected their numbers in 2026 are doing something fundamentally different: they’re reading the fee schedule not as a price list but as a map of operational decisions. Every fee on that list corresponds to a choice a seller made — about packaging, inventory levels, shipment routing, fulfillment method, or catalog breadth. Change the choice, and you change the cost.
This article is not a summary of Amazon’s 2026 fee announcements. There are plenty of those. Instead, it’s a systematic look at where each fee layer is actually created — the upstream operational decisions that drive it — and what the most effective tactical responses look like at the SKU level. The goal is a margin-defense playbook built around the real mechanics of the 2026 fee structure, not its headlines.
The Full Fee Stack: Why One Number Never Tells the Truth
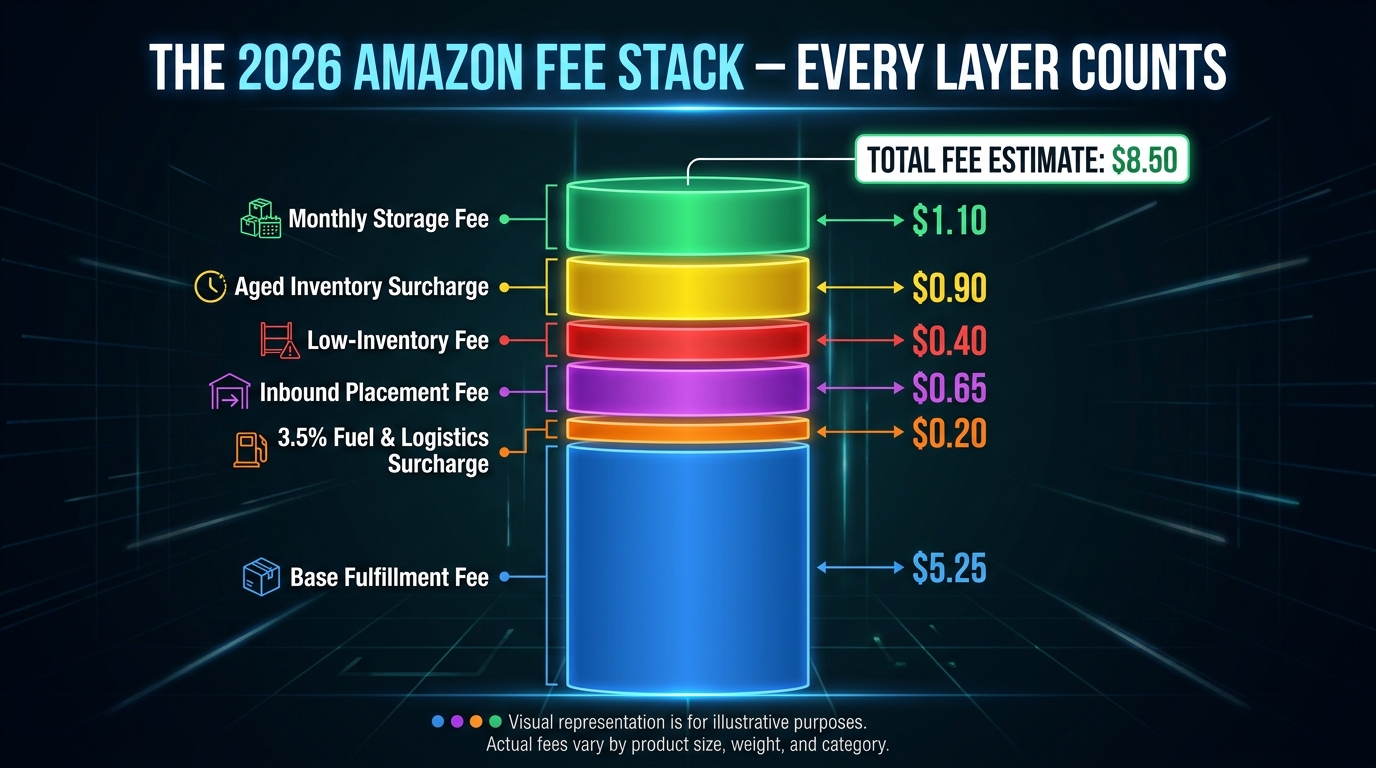
The most important shift in how Amazon fees work in 2026 is not the size of any individual change — it’s the layering architecture. Amazon has moved from a relatively simple two-part cost structure (referral fee + fulfillment fee) to a multi-layer system where each additional fee is conditional on different operational variables. The total cost per unit sold is now the product of at least six distinct fee categories, not two.
Layer 1: The Base Fulfillment Fee
Effective January 15, 2026, Amazon increased standard FBA fulfillment fees by an average of $0.08 per unit. The change is structured by weight band and price tier rather than applied uniformly, which means the impact is asymmetric. Standard-size items in the $10–$50 price range absorb the increase most evenly. Items at price extremes — very low-priced products and heavy items — may see disproportionate cost pressure relative to their selling price.
Amazon simultaneously restructured the Large Bulky category, splitting it into Small Bulky and Large Bulky tiers and removing the SIPP (Ships in Product Packaging) discount for bulky items that don’t qualify. For sellers with packaging-intensive products in the bulky tier, this is a more significant change than the headline $0.08 figure suggests.
Layer 2: The 3.5% Fuel and Logistics Surcharge
Beginning April 17, 2026, Amazon applied a new 3.5% fuel and logistics surcharge on top of base FBA fulfillment fees in the US and Canada. The surcharge extended to Buy with Prime and Multi-Channel Fulfillment (MCF) orders starting May 2, 2026. This is structurally different from a flat fee increase — it compounds on the base fee, meaning higher-cost fulfillments absorb a larger absolute dollar impact. A product with a $4.50 base fulfillment fee now carries an additional $0.16 in surcharge costs.
Layer 3: Inbound Placement Fees
Introduced in 2024 and fully matured in 2026, the inbound placement fee charges sellers for the right to ship to a single or minimal number of Amazon fulfillment centers. The range is approximately $0.20 to $0.70+ per unit depending on size tier and product category — and the only path to a $0 fee is accepting Amazon-optimized multi-location splits. Many sellers are still absorbing these costs without realizing the $0 path exists.
Layer 4: Low-Inventory Level Fee
The low-inventory level fee, now calculated at the FNSKU level rather than the parent ASIN level, activates when an individual variation falls below approximately 28 days of supply relative to historical demand. This change is operationally significant: a seller with a well-stocked hero size who has let auxiliary sizes run thin is now penalized on every unit sold of those undersupplied variants, even if the parent ASIN looks healthy in aggregate.
Layer 5: Aged Inventory Surcharge
The aged inventory surcharge activates at 181 days in storage and applies monthly, stacked on top of regular monthly storage fees. The tier structure escalates steeply through 271, 365, and 456+ day thresholds — reaching as high as $7.90 per cubic foot or $0.35 per unit at the highest tier. For low-velocity products, this surcharge can exceed the product’s total margin in a matter of months.
Layer 6: Monthly Storage Fees
Base monthly storage fees remain in effect alongside the surcharges. Q4 rates are higher than off-peak months. Storage utilization surcharges apply when utilization exceeds certain thresholds for sellers on high-utilization plans. In total, the monthly carrying cost for a slow-moving FBA unit across all storage-related fees can make a product appear profitable on a per-order basis while hemorrhaging cash at the inventory level.
The key insight: The sellers absorbing the most cost in 2026 are not necessarily selling the wrong products — they’re operating under operational defaults that trigger multiple fee layers simultaneously. Address the operational trigger, and you often eliminate two or three fees at once.
The Low-Inventory Fee Trap: Why FNSKU-Level Tracking Changes Everything
The shift from parent-ASIN to FNSKU-level low-inventory fee calculation is one of the most consequential structural changes in the 2026 fee update — and it’s the one most frequently underappreciated by multi-variation sellers.
The Old Logic vs. The New Reality
Under the previous system, a seller with a five-color variation set could allow slower-moving colors to run lean as long as the parent-level aggregate inventory position was healthy. The average supply across all variations smoothed out individual variation stockouts. That logic is now broken. Each FNSKU is evaluated independently against its own historical demand rate. A color that sells 10 units per week and holds 15 days of supply is generating a low-inventory fee on every unit sold — regardless of the fact that three other colors in the same parent ASIN are sitting at 90 days of supply.
The Compound Problem for Variation-Heavy Sellers
For apparel, footwear, home goods, or any category with substantial variation sets, the FNSKU-level change can multiply the effective low-inventory fee exposure across an entire catalog. A seller managing 40 parent ASINs with an average of 6 variations each has 240 independent inventory positions to track. Statistical probability alone means that at any given time, a meaningful percentage of those positions will fall below the 28-day threshold — especially during Q4 sell-through or post-peak recovery periods.
Expert analysis suggests that sellers who haven’t adjusted their inventory replenishment logic to operate at the FNSKU level are seeing an effective fee impact two to three times higher than the headline numbers would predict for their size tier.
What the Fix Actually Looks Like
The operational response has two components. First, inventory planning tools — whether Amazon’s own Restock Inventory tool, a third-party platform like Skubana or Inventory Planner, or a custom spreadsheet model — need to be reconfigured to evaluate each FNSKU independently. Aggregate views that roll up to the parent ASIN are now insufficient for fee management.
Second, sellers need to make explicit decisions about which variations to actively stock versus which to phase out or convert to FBM. A variation that sells two units per month probably cannot sustain the minimum inventory position required to avoid the low-inventory fee on an ongoing basis. The math of holding 30+ units of a slow mover in perpetuity to avoid a per-unit fee often doesn’t work. In those cases, removing the variation from FBA and fulfilling it from your own location or a 3PL is often the correct answer — not stocking deeper on low-velocity variants.
Key Metric to Monitor
Pull your FBA Inventory report filtered by “Days of Supply” at the FNSKU level weekly, not monthly. Any FNSKU below 28 days that you didn’t deliberately choose to run lean on is a fee you’re generating unnecessarily. The 30-second weekly review of that filtered list is worth hundreds of dollars per month for most multi-variation sellers.
Inbound Placement Fees: The $0 Path Most Sellers Are Still Missing
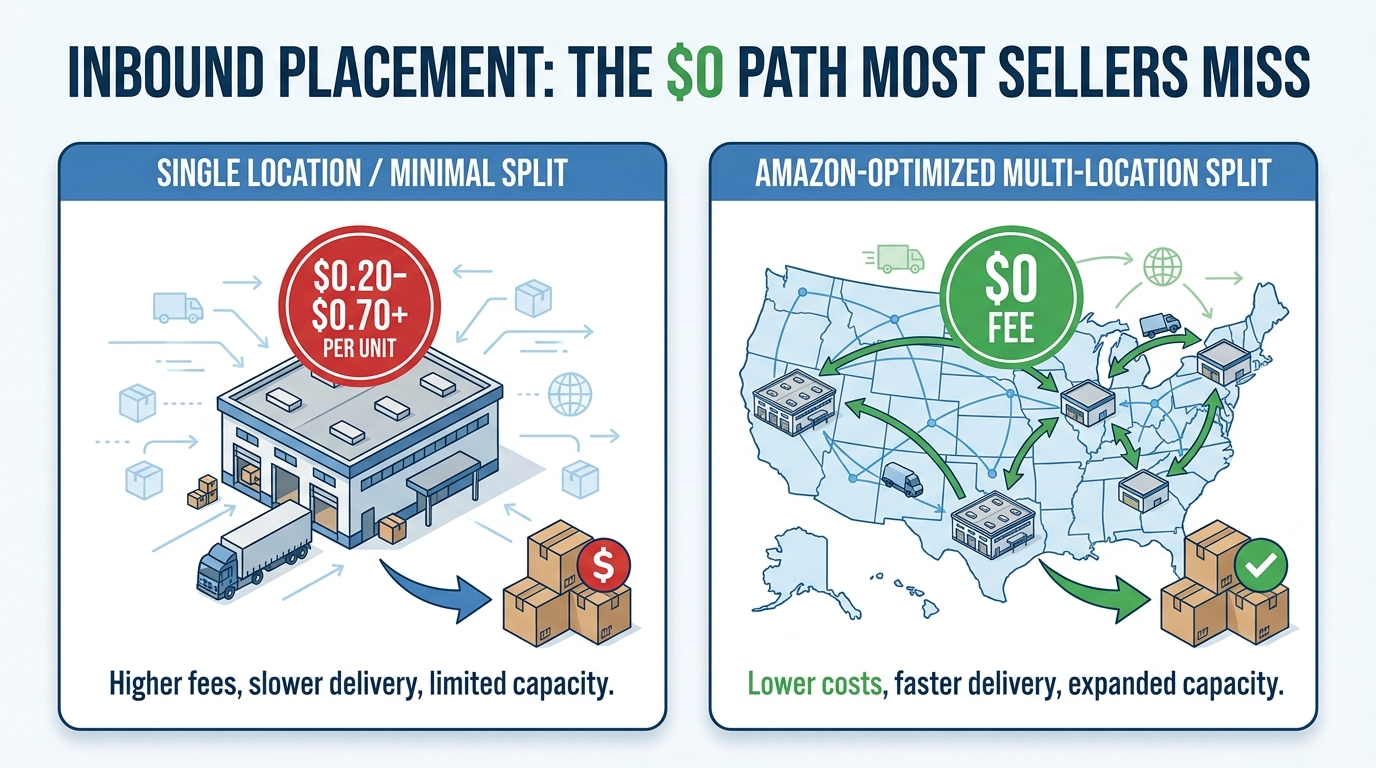
The inbound placement fee is perhaps the most structurally interesting fee in the 2026 stack because it has a fully legal, by-design zero-dollar path — yet a substantial portion of sellers are still paying it on most shipments.
How the Fee Structure Works
When a seller sends inventory to a single Amazon fulfillment center (FC) or chooses a “minimal split” shipment option, Amazon charges an inbound placement fee to offset its internal cost of redistributing that inventory across its network. The fee ranges from approximately $0.20 to $0.70+ per unit depending on the product’s size tier, with bulkier items attracting higher charges.
The alternative — accepting Amazon’s “optimized” split recommendation, which may direct inventory to four or five different fulfillment centers across the country — eliminates the placement fee entirely. Amazon considers this arrangement cost-neutral for them because they’re not doing the redistribution; the seller is absorbing the freight cost of shipping to multiple destinations.
Why Sellers Default to Single-Location Shipping
The single-FC approach feels operationally simpler. One destination, one shipment, one carrier relationship. For sellers manufacturing overseas and importing via ocean freight, the idea of splitting a container’s worth of inventory across five FCs is logistically messy. The inbound placement fee, viewed in isolation, can look like the cheaper option versus the carrier cost of multiple shipments from a single import port.
The error in that reasoning is that the calculation needs to be modeled, not assumed. In many cases — particularly for standard-size products at moderate per-unit weight — the blended freight cost of multi-FC shipping via Amazon’s Partnered Carrier Program is lower than the inbound placement fee on the single-location alternative. The Partnered Carrier rates Amazon offers are often below market, which changes the break-even point significantly.
The AWD Bridge Strategy
A second zero-placement-fee path involves Amazon’s own AWD (Amazon Warehousing and Distribution) service. Sellers who use AWD as upstream bulk storage and let Amazon manage distribution to FCs qualify for the same $0 placement fee treatment, because Amazon is handling the multi-location split internally. AWD also carries a 25% storage discount versus standard FBA rates for units stored there, plus Amazon-quoted transportation costs that can run 15–25% below market on cross-border routes.
The AWD model doesn’t work for every product type or velocity profile — it adds a handling step and requires minimum volume thresholds to make economic sense — but for sellers with consistent-velocity, standard-size products, it can eliminate placement fees while simultaneously reducing upstream storage costs.
The Tactical Calculation
Before your next inbound shipment, model three scenarios using Amazon’s fee preview in Seller Central’s shipment creation workflow: minimal split (1 FC), partial split (2-3 FCs), and Amazon-optimized split (4-5+ FCs). Compare the estimated placement fee against the incremental freight cost of each scenario using Partnered Carrier rates. In most cases, the optimized split pencils out for medium-to-high velocity products. Reserve the minimal split option for test quantities, low-velocity SKUs, or situations where the freight premium genuinely exceeds the placement fee.
Aged Inventory Surcharges: Mapping the Monthly Cliff
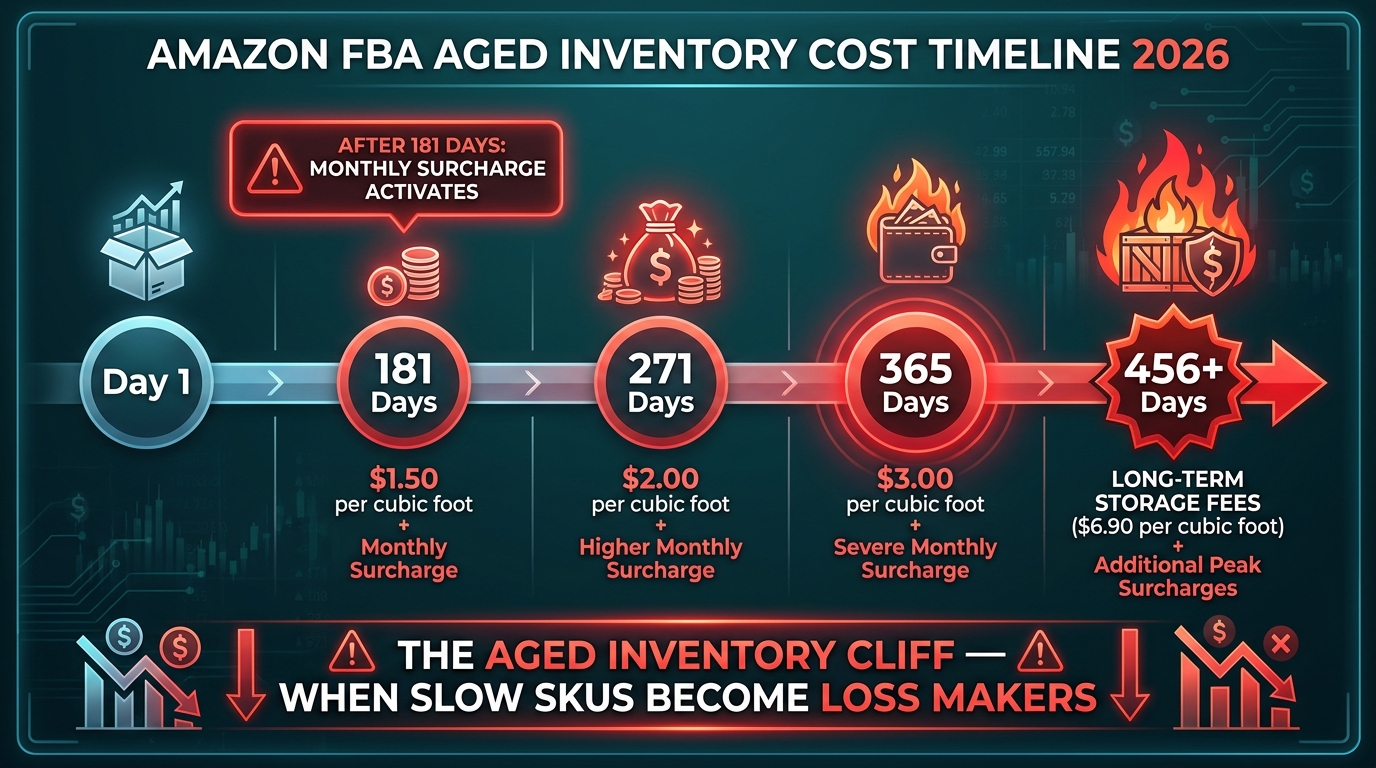
The aged inventory surcharge in 2026 has a specific characteristic that makes it particularly dangerous for sellers who manage their FBA operations on a monthly or quarterly cycle rather than continuously: it activates and escalates at precise calendar thresholds, charged on the 15th of each month, and the decision window to avoid a given month’s charge closes at 11:59 PM PT on the 14th.
The Threshold Architecture
Units aged between 181 and 270 days begin incurring the first tier of aged inventory surcharge on top of regular monthly storage fees. The rate escalates at the 271-day mark into a materially higher tier, again at 365 days, and reaches the maximum published rate at 456+ days — up to $7.90 per cubic foot or $0.35 per unit depending on the calculation basis Amazon applies to the specific product.
For a product with a $0.45 per cubic foot monthly storage rate in off-peak months, crossing into the 271-day tier effectively multiplies the storage cost on that unit by a factor of 10 to 15. This is not a gradual compression of margin — it’s a fee cliff. Units that cross it have, in many cases, already erased the profit from their eventual sale.
Why Sellers Let Inventory Age
The pattern behind aged inventory is usually not negligence — it’s optimism. A product that was selling well enters a slow period. The seller expects velocity to recover. Months pass. The product is still there. The original cost of the inventory creates an anchoring effect that makes the seller reluctant to take the markdown or removal cost that would have been far cheaper three months ago. By the time the 181-day threshold is crossed, the psychological cost of acknowledging the loss has already been incurred — but the financial cost is only beginning.
A secondary driver is variant proliferation. Sellers who manage large catalogs with many size, color, or bundle variants will almost always have some slow-moving items in the mix. Without active monitoring, those slow movers slide toward the age threshold while the seller’s attention is on the fast-moving core products.
The Proactive Response Framework
The most effective approach to aged inventory management in 2026 is forward-looking, not reactive. Instead of checking the Inventory Age report to see what’s already past 180 days, the goal is to identify units approaching 120 days with insufficient velocity to sell through before the 181-day threshold activates.
At 120 days of age, the available options are still relatively attractive: a targeted promotion, a Sponsored Products bid increase, a price reduction, or enrollment in an Amazon Outlet deal can often generate enough velocity to clear the units before the surcharge kicks in. At 170 days, options narrow significantly — the lead time for promotional approval, deal enrollment, or market response may not be enough to beat the deadline.
Set up a standing filtered view of your FBA Inventory Age report showing units aged 90–150 days. Assign each product in that bucket a “clearance velocity target” — the weekly unit rate needed to exhaust the stock before day 181. If current velocity is below that target, act immediately. If it’s above it, monitor weekly. This 90-day pre-cliff window is the most valuable inventory management real estate in the FBA calendar.
Removal vs. Liquidation vs. Markdown: The Decision Matrix
For units already past 180 days with insufficient velocity to sell through at acceptable prices before the next surcharge tier, three options exist: removal (units shipped back to you for a per-unit fee, typically $0.97–$1.90 for standard-size items), liquidation (Amazon sells units at 5–15 cents on the dollar, netting you typically 2–8% of the average selling price), or a deep markdown within FBA to drive clearance velocity. The right answer depends on whether the product has secondary value to you (return to supplier, repackage, sell on another channel) versus no recoverable value. Liquidation is almost always the floor; removal is preferred when the product has any downstream value. A deep markdown that drives sell-through often beats both if the resulting price still covers the unit’s landed cost.
Packaging Engineering: The Underrated Profit Lever
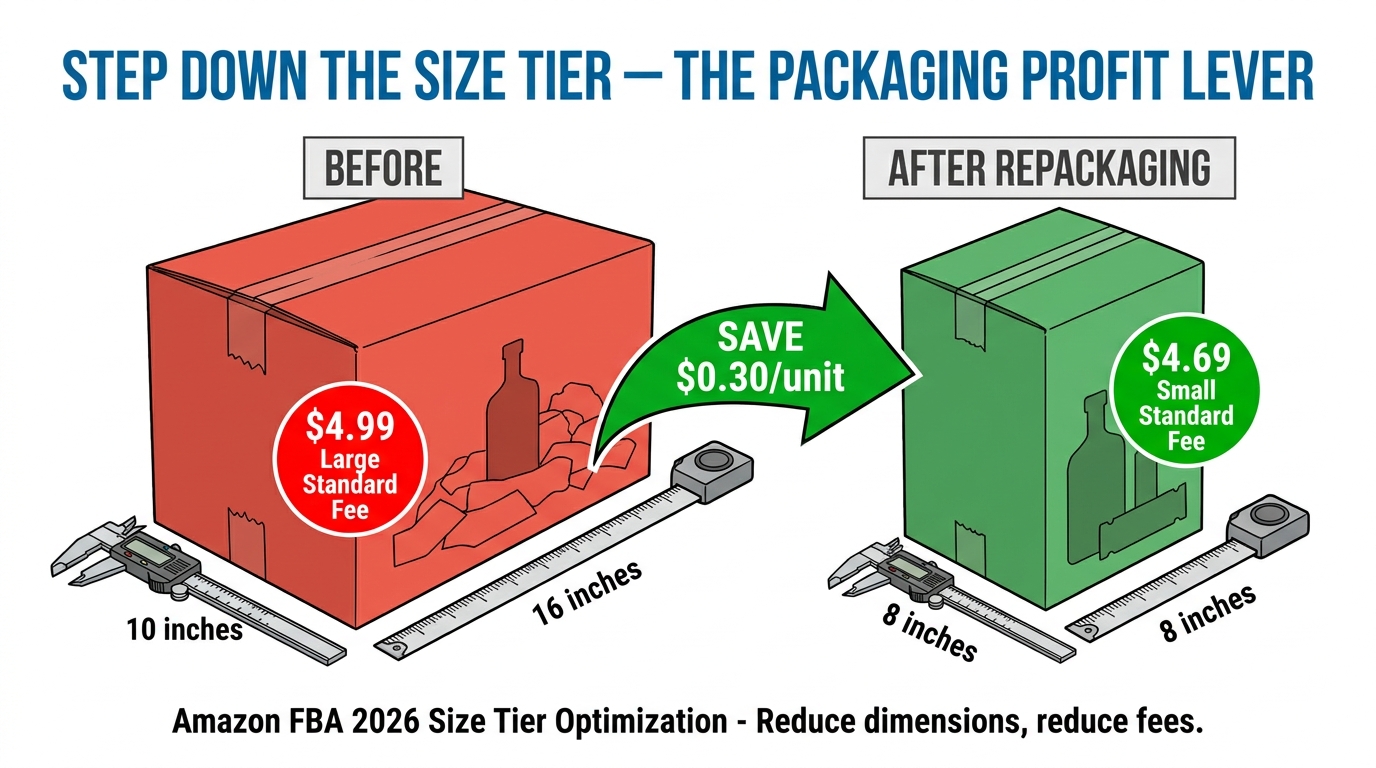
Amazon’s fulfillment fees are calculated based on the packaged unit’s dimensions and weight — not the product itself. This distinction matters because packaging decisions that were made years ago, before the 2026 fee structure existed, may now be routing products into size tiers that are costing significantly more than necessary.
The Size Tier Economics
Amazon’s 2026 size tier boundaries create meaningful cost jumps at specific dimensional and weight thresholds. Crossing from one tier to the next — from Small Standard to Large Standard, or from Large Standard to Small Bulky — can mean a fee increase of $0.30 to $1.50+ per unit depending on the category. For a product selling 2,000 units per month, a $0.40 tier difference is $800 per month in additional fees — or nearly $10,000 annually on a packaging decision that might cost $2,000 to change.
The first action is measurement. Pull your current product dimensions from your FBA shipment reports and cross-reference them with the 2026 tier boundaries. Identify any products that are “just over” a tier boundary — within 10–15% of the threshold on at least one dimension. These are the candidates for packaging re-engineering.
What Packaging Re-Engineering Actually Involves
The goal is not to reduce packaging quality or product protection — it’s to eliminate dimensional waste. Products in decorative retail boxes that are significantly larger than the product inside are the most obvious targets. A product that sits in a box with two inches of air padding on all sides probably doesn’t need that much space to survive the FBA handling process. Switching to form-fitted packaging — molded inserts, tighter polybag configurations, or right-sized kraft boxes — can reduce dimensional weight by 20–40% without any change to the product or its protection in transit.
For products currently in the Large Standard tier primarily due to weight rather than dimensions, the calculation is different. Weight reduction through packaging changes (lighter materials, elimination of unnecessary inserts or components) can shift the dimensional weight calculation. Even a 0.3 oz reduction per unit moves the needle when multiplied across monthly volume.
The SIPP Qualification Question
Amazon’s Ships in Product Packaging (SIPP) program allows products to ship in their original manufacturer packaging without an additional Amazon box, potentially qualifying for reduced packaging fees. The 2026 updates removed SIPP eligibility for bulky items that can’t meet the program’s structural requirements — but for standard-size products, SIPP qualification remains a viable cost reduction path for items with robust retail packaging. Check your current SIPP eligibility status in the FBA Packaging Requirements section of Seller Central and model the fee impact of qualifying versus non-qualifying status.
The Bundle Effect on Per-Unit Fee Math
Bundling — selling two or more products together as a single ASIN — has an interesting interaction with the fee structure. A bundle that pairs two individual items, each with a $3.22 fulfillment fee, into a single pack doesn’t automatically cost $6.44 to fulfill. If the bundled package meets the dimensional and weight requirements for the same size tier as each individual item, the fulfillment fee for the bundle is closer to $3.50–$4.20 — and the revenue per transaction has roughly doubled. The per-unit economics of a well-designed bundle can be significantly better than the individual units, provided the incremental packaging cost of the bundle doesn’t eliminate the fee savings.
The FBA vs. FBM/3PL Decision: A SKU-Level Framework, Not a Policy
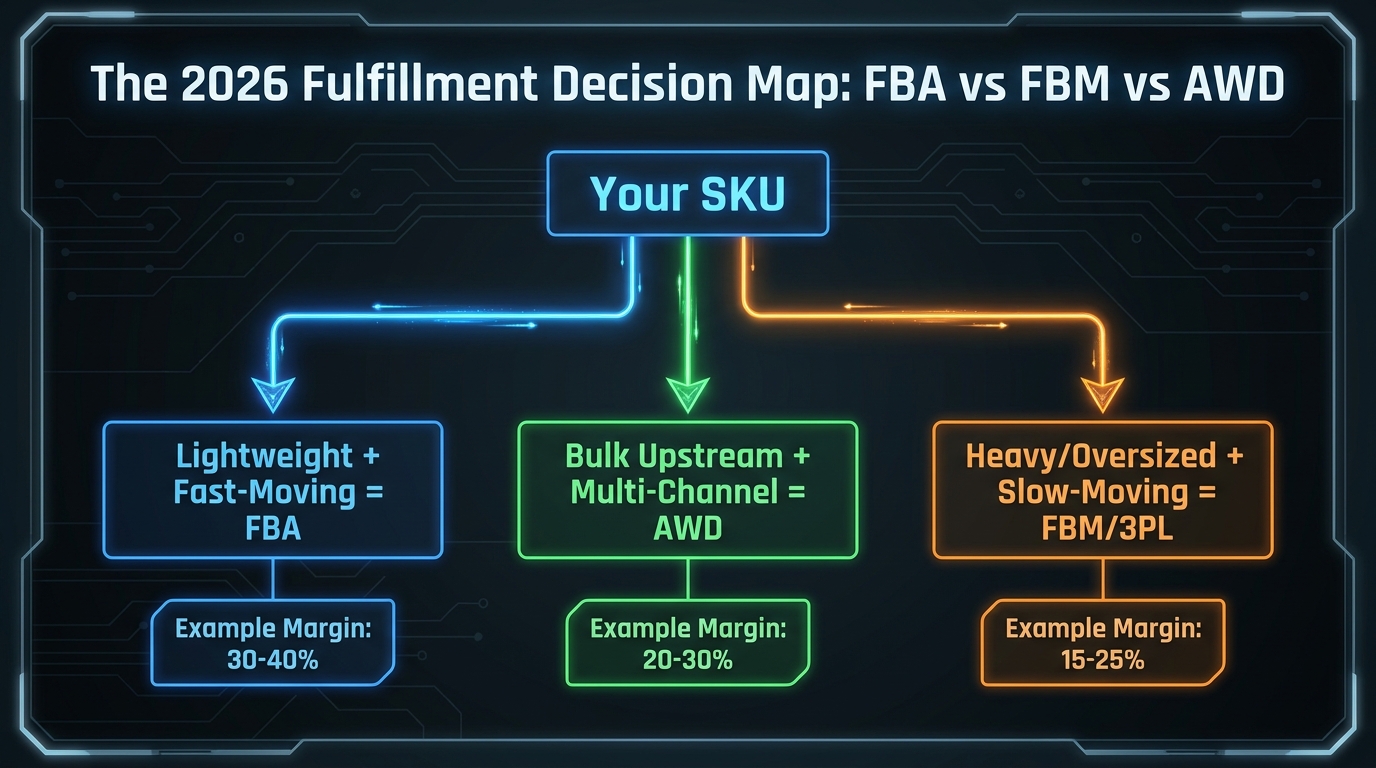
One of the most persistent mistakes in Amazon margin management is treating “FBA vs. FBM” as a business-level decision when it’s actually a SKU-level calculation. The right answer for your fastest-selling, lightest item is almost never the right answer for your heaviest, slowest-moving variant.
When FBA Wins on Margin
FBA has the strongest economic case for products that are lightweight, small standard-size, fast-moving, and price-elastic enough to absorb the fee stack. For these products, Prime eligibility drives a meaningful conversion lift — estimates consistently range from 15% to 30% higher conversion rate for Prime-eligible listings — and the fulfillment cost is reasonable relative to the average order value. When the revenue uplift from Prime is included in the calculation, FBA often outperforms FBM even on margin percentage, not just on revenue.
One 2026 analysis of a $29.99 standard-size product showed FBA delivering a 35.8% net margin versus 27.6% for FBM with a third-party logistics provider — a counterintuitive result explained by the Prime conversion premium and the speed advantage that FBA provides in competitive niches. The FBA advantage is largest in categories with high elasticity to delivery speed.
When FBM or 3PL Wins
The FBA advantage erodes — and often reverses — for products that are heavy, oversized, slow-moving, or seasonal. For heavy items, the base fulfillment fee plus the 3.5% surcharge can consume 25–35% of a product’s selling price before referral fees are counted. For slow-moving items, the storage cost accumulation between orders makes FBA storage fees a significant ongoing cost that FBM eliminates entirely. For seasonal items, the risk of aging inventory and the associated surcharges adds a probability-weighted cost that needs to be included in any honest comparison.
The 3PL alternative in 2026 has also improved meaningfully. Warehouse management technology has lowered the operational overhead of FBM, and third-party logistics providers can now offer Amazon-compliant packaging and labeling for Seller Fulfilled Prime (SFP) that, for qualifying sellers, preserves the Prime badge while removing inventory from Amazon’s storage cost structure. SFP’s performance requirements are demanding — 99.9% on-time shipping and cancellation rates below 0.5% — but for high-volume sellers with reliable fulfillment infrastructure, it remains a viable middle path.
Building the Hybrid Catalog Model
The practical approach for sellers with catalogs spanning multiple weight tiers, velocity bands, and margin profiles is a quarterly SKU segmentation review. Segment your catalog into four categories:
- FBA Core: Lightweight, fast-moving, standard-size products where Prime conversion is a competitive necessity. These stay in FBA.
- FBA Review: Products where the fee stack consumes more than 35% of selling price. Model FBM/3PL margins specifically for these SKUs.
- FBM/3PL Candidates: Heavy, oversized, or slow-moving products where FBA storage + fulfillment fees exceed third-party shipping costs. Migrate these out of FBA.
- Sunset List: Products where neither FBA nor FBM pencils out profitably at current prices. These require either a price increase, a cost reduction, or discontinuation.
Running this segmentation quarterly — particularly after any Amazon fee change announcement — keeps the catalog in alignment with the economics rather than operational inertia.
Pricing Surgery: Where to Raise, Where to Hold, Where to Cut
The conventional response to a cost increase is to raise prices. In an Amazon context, that logic is partially correct and partially dangerous — because Amazon’s search algorithm, Buy Box eligibility, and competitive dynamics don’t respond uniformly to price changes. Pricing decisions in 2026 require more surgical thinking than a blanket percentage increase.
Identifying Price-Elastic vs. Price-Inelastic SKUs
Before making any price changes in response to fee increases, run a 90-day conversion rate analysis segmented by price point for each of your core ASINs. Products where your conversion rate held steady across small historical price increases are candidates for price adjustment. Products where conversion rate dropped sharply with previous price increases are price-sensitive; raising those prices to cover fee increases may generate less total revenue, not more.
The most dangerous assumption is that all products in the same category have the same price elasticity. A brand-name product in a fragmented category often has more pricing power than a private label competing on the same keywords. A product with hundreds of reviews and strong ratings has more room to raise prices than a newer listing building social proof. These nuances must be evaluated at the individual ASIN level.
The $X.99 Price Band Effect
Amazon’s fee structure in 2026 introduces price-band thresholds that interact with both referral fees and certain promotional program eligibilities. Products priced just below key thresholds — $9.99, $14.99, $24.99 — sometimes have different effective fee economics than products just above them, because Amazon’s fee calculations use specific price brackets. Before raising a price above one of these thresholds, model the full fee impact of crossing the band.
Additionally, certain pricing levels trigger or remove eligibility for programs like Amazon Vine, Lightning Deals, and Coupons, which can affect conversion rates downstream. A $0.50 price increase that crosses a bracket threshold might increase the listed price by 2% while reducing promotional program eligibility in ways that cost 5–8% in conversion. Net margin can go negative from the change even though the listed price went up.
Where Price Increases Work Best
The safest targets for price increases are products with: strong review counts (500+), dominant Buy Box share, limited direct competitive alternatives, high repeat purchase rates, and brand recognition that provides some switching cost. These products have demonstrated that customers value them at or above current prices and have limited substitution options. A 3–5% price increase on a product meeting those criteria is unlikely to generate meaningful conversion damage and will partially offset the fee increase.
The SKU Pruning Alternative
For products where price increases aren’t viable and costs can’t be reduced enough to restore acceptable margins, the correct response may be to exit the ASIN rather than maintain it at breakeven or below. Zombie products — ASINs that generate marginal revenue at minimal margin — consume operational bandwidth, Sponsored Products budget, and storage capacity that could be reallocated to profitable products. SKU pruning is not failure; it’s capital allocation discipline. In 2026’s tighter fee environment, it has become a competitive advantage for sellers willing to make the call.
AWD and Supply Chain by Amazon: When the Integrated Path Costs Less
Amazon’s Amazon Warehousing and Distribution (AWD) service has matured significantly since its introduction, and the 2026 fee changes have made it economically relevant to a broader range of sellers than in previous years. The fee changes effectively raised the cost of not using AWD for certain product profiles, which changes the comparative economics materially.
What AWD Actually Does
AWD is an upstream bulk storage and distribution layer that sits between manufacturing/import and FBA fulfillment centers. Instead of shipping directly from your supplier or own warehouse to FBA fulfillment centers, you ship to AWD bulk storage, and Amazon manages the transfer of inventory to FBA FCs based on demand signals. The full stack — from manufacturing through to FBA — is what Amazon calls “Supply Chain by Amazon.”
The economic claims Amazon makes about the service are worth taking seriously because they’re directionally consistent with what third-party analyses have found:
- AWD storage rates run approximately 25% lower than standard FBA storage rates for units held in AWD facilities.
- Cross-border transportation costs (particularly China-to-US) are quoted at up to 25% below market rates for sellers using AWD as the destination.
- Transportation and processing costs within the Supply Chain by Amazon network run approximately 15% lower than equivalent external logistics.
- Sellers using AWD qualify for the $0 inbound placement fee because Amazon manages the multi-FC distribution internally.
- Unified inventory management through AWD reduces total safety stock requirements by an average of 20%, freeing working capital.
When AWD Makes Sense — and When It Doesn’t
AWD’s economics work best for products with consistent demand velocity, reasonable unit count volumes, standardized packaging, and cross-border or long-distance supply chains. The service adds a handling step between manufacturing and FBA, which increases lead time and adds some complexity. For products with highly volatile or seasonal demand, the automatic replenishment logic may not align well with your actual inventory strategy.
For products that meet the volume and velocity criteria, the combination of lower storage costs, $0 placement fees, and transportation savings can reduce total logistics costs by 8–18% depending on the specific product and supply chain configuration. That’s a meaningful margin recovery — equivalent to or greater than the impact of the 2026 fee increases on standard-size, mid-velocity products.
The Setup Investment
Transitioning to AWD requires changes to inbound shipping processes, label configurations, and potentially supplier relationships. It’s not a zero-effort change. Sellers who’ve made the transition typically report a 30–60 day operational adjustment period. The question is whether the ongoing savings justify that investment — and for catalogs with consistent core products, the math almost always says yes within the first year.
The Complete Per-Unit Cost Model Every Seller Needs in 2026
One of the systemic gaps in how most Amazon sellers manage fees is the absence of a comprehensive, SKU-level profitability model that accounts for the full 2026 fee stack. Most sellers track margin based on (selling price) – (COGS) – (FBA fee) – (referral fee) = margin. That model is missing at least three significant cost categories that the 2026 fee structure has made material.
Building the Ten-Component Model
A complete 2026 per-unit profitability model needs to include:
- COGS: Landed cost per unit including manufacturing, freight, customs, and prep.
- Referral fee: Typically 6–17% of selling price depending on category.
- FBA fulfillment fee: Size/weight-tiered base fee.
- Fuel and logistics surcharge: 3.5% of the fulfillment fee.
- Inbound placement fee: Amortized per unit based on shipment routing choice.
- Monthly storage cost: Cubic footage × storage rate ÷ monthly units sold.
- Aged inventory risk reserve: A probability-weighted cost based on the product’s historical aging rate and the surcharge tiers that apply.
- Low-inventory fee: Modeled based on FNSKU-level inventory consistency.
- Advertising cost of sale (ACoS): Sponsored Products and other PPC spend per unit sold.
- Return rate impact: Returns cost (processing fee + disposition) amortized across sold units.
When all ten components are included, the resulting margin figure is often 8–15 percentage points lower than the simplified two-variable calculation produces. That gap is what separates sellers who believe they’re operating at 35% margin from sellers who know they’re operating at 22% margin — and what drives dramatically different decisions about which products to grow, hold, or exit.
The Return Rate Problem Nobody Models
Buried beneath the discussion of fulfillment, storage, and placement fees is a cost category that receives far less attention: return processing fees and associated reverse logistics costs. When a customer returns an FBA item, Amazon charges a returns processing fee for items in categories where free returns are offered. This fee typically ranges from $2 to $8+ for standard-size items in return-prone categories. For a product with a 15% return rate selling at $29.99, the blended returns cost across sellable and unsellable units can easily represent $0.60–$1.20 per unit sold — a cost that shows up reliably in the P&L but rarely in the margin estimate.
The practical fix is improving listing accuracy. Better images, more precise size guides, more accurate product descriptions — these reduce the gap between customer expectation and product reality, which is the root cause of most returns. A 2% reduction in return rate on a high-volume ASIN can save thousands of dollars annually in return processing fees, inventory write-downs, and reverse logistics costs.
Building the Model in Practice
Build this model in a spreadsheet or your preferred analytics tool. The inputs for items 1–6 are largely available from Amazon’s fee reports and your own purchasing data. For items 7–8, use historical aged inventory data and low-inventory fee reports from the past 90 days to calibrate your per-ASIN risk rates. For items 9–10, use your actual 90-day advertising reports and return rate data by ASIN.
Run this model for every ASIN in your catalog at least quarterly. The outputs should drive three decisions: which products to grow (healthy margin, positive trend), which to maintain (acceptable margin, stable trend), and which to exit or restructure (compressed margin, deteriorating trend).
Building a Margin-Defense Cadence: The Quarterly Audit Framework
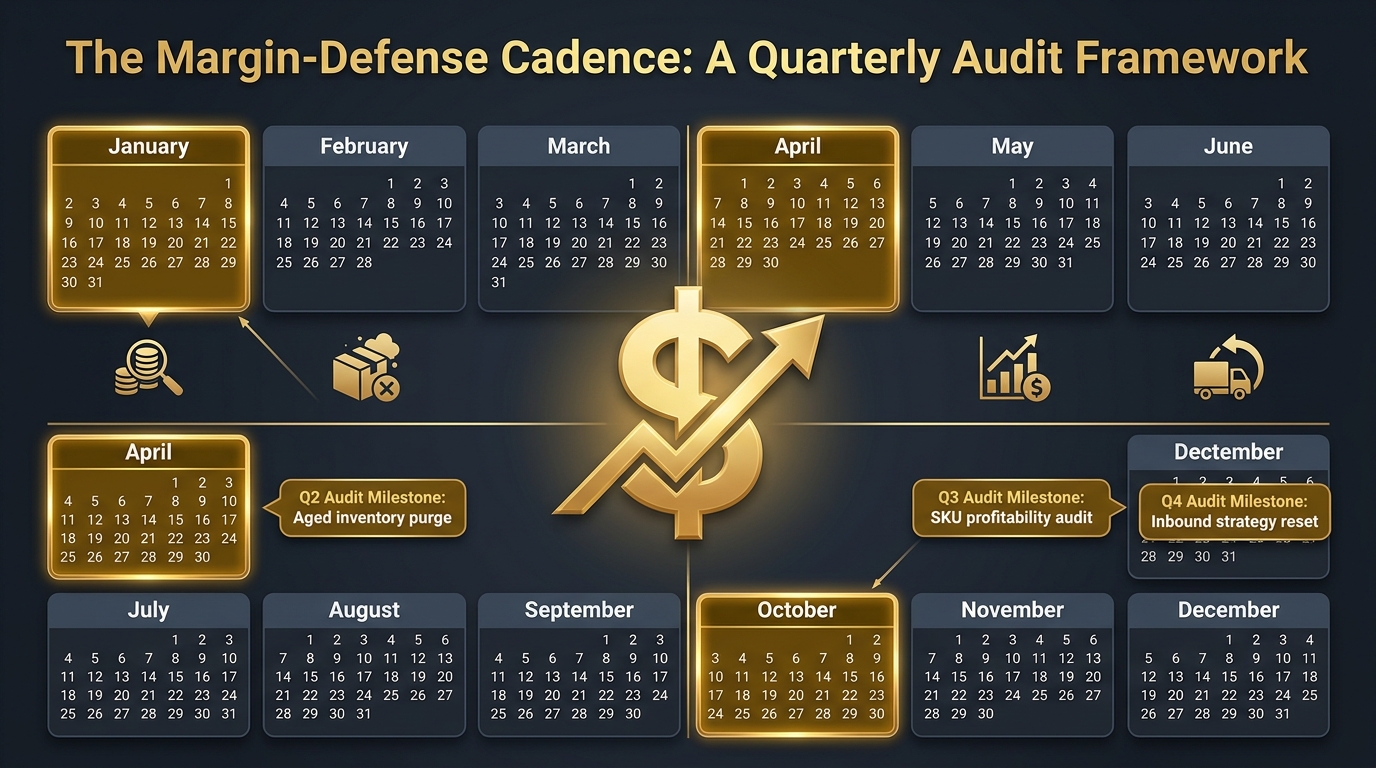
Responding to Amazon fee changes reactively — reading about a new fee announcement, then scrambling to assess its impact — is a structurally inferior approach to fee management. The 2026 fee environment, with its multiple overlapping layers and operational triggers, rewards sellers who have built a regular audit cadence that surfaces cost problems before they compound.
The Five-Point Quarterly Audit
Run the following audit four times per year, ideally in January, April, July, and October — aligned with Amazon’s typical fee adjustment schedule and Q4 preparation timing:
1. Fee Structure Review (1–2 hours)
Check Amazon Seller Central’s Fee Schedule and any announcements made in the preceding quarter. Map any new fees or rate changes to your specific size tiers and product categories. Update your per-unit cost model with new rates. Identify which products in your catalog are most exposed to the changes.
2. FNSKU-Level Inventory Audit (1–2 hours)
Pull the FBA Inventory Age report and the Inventory Health report. Identify FNSKUs below 28 days of supply (low-inventory fee exposure) and units approaching 120 days of age (pre-cliff clearance window). Create a priority action list for both categories.
3. Inbound Strategy Review (30–60 minutes)
Review the inbound placement fees paid in the prior quarter by ASIN. Identify any high-volume products where the minimal split was chosen. Calculate whether the optimized split would have been cheaper given actual freight costs. Adjust the default shipment routing decision for the next quarter.
4. SKU Profitability Rank Update (2–3 hours)
Run the complete ten-component margin model for all active ASINs. Rank products by contribution margin and flag any that have crossed into breakeven or negative territory since the last quarterly review. Assign each flagged product to one of three actions: price increase test, cost reduction project, or exit planning.
5. Packaging and Weight Audit (1 hour, every other quarter)
Pull dimensional data for your five to ten highest-volume ASINs and verify against current size tier thresholds. Flag any products within 15% of a tier boundary. Evaluate whether packaging re-engineering is justified given the per-unit fee savings at current volume.
The Real Cost of Not Having a Cadence
Sellers without a regular audit cadence typically discover fee-related margin problems in one of three ways: a sudden drop in bank account balance that triggers an investigation, an accountant’s year-end review that reveals profitability is far lower than expected, or an ASIN that becomes negative margin and starts generating performance notices. All three discoveries arrive late and with limited time to respond optimally. A quarterly cadence converts fee management from an emergency response activity into a routine planning function — and that shift alone is worth several percentage points of margin for most catalog sizes.
Tooling Considerations for 2026
The Amazon Seller Central reporting suite provides most of the raw data needed for these audits, but extracting and organizing it manually is time-consuming. Several third-party platforms — Sellerboard, ManageByStats, Helium 10’s Profits tool, and Jungle Scout’s Sales Analytics — provide pre-built margin dashboards that automate much of the data aggregation. For sellers managing more than 50 active ASINs, the time savings from one of these tools typically justifies the subscription cost within the first quarter of use. For smaller catalogs, a well-structured Google Sheets template connected to Amazon’s Selling Partner API can achieve similar results at lower cost.
Conclusion: Protecting Margin Is Now an Operational Discipline
Amazon’s 2026 fee changes are not exceptional in magnitude — the headline $0.08 per-unit increase genuinely is modest. What makes the 2026 environment more demanding than previous years is the cumulative complexity of the full fee stack and the degree to which each fee layer is triggered by specific operational decisions rather than being an unavoidable cost of doing business.
That complexity is actually an opportunity for sellers willing to engage with it at the operational level. Each fee layer has a lower-cost path — a $0 inbound placement alternative, a packaging configuration that stays in a cheaper tier, an inventory profile that avoids the low-inventory fee, a sell-through cadence that never crosses the aged inventory cliff. None of these paths is hidden or arcane. They’re all documented in Amazon’s fee schedules. The sellers who follow them consistently are recovering 2–5 percentage points of margin that their less-attentive competitors are leaving on the table.
The practical takeaways from this analysis:
- Model the full fee stack, not just fulfillment and referral fees, for every active ASIN.
- Rebuild your inventory planning at the FNSKU level — parent-ASIN aggregates are no longer sufficient for fee management.
- Default to Amazon-optimized multi-location inbound splits unless the freight premium genuinely exceeds the placement fee on a specific shipment.
- Set calendar alerts 60 days before your first-unit aging threshold — not after units have crossed 180 days.
- Measure packaging dimensions against 2026 tier thresholds and identify re-engineering candidates before the next production run.
- Treat FBA vs. FBM as a per-SKU decision reviewed quarterly, not a one-time business policy.
- Run the quarterly audit cadence — fee management is now a scheduled operational discipline, not an ad hoc response activity.
The sellers who emerge from 2026’s fee environment with protected margins won’t have found a workaround or a shortcut. They’ll have built better operational systems — tighter inventory tracking, more informed shipping decisions, more honest SKU economics. In a marketplace where fees are a permanent feature of the landscape and likely to grow more complex over time, that operational discipline is the only durable advantage.